Scandinavian vs Belizean Associate's Degree
COMPARE
Scandinavian
Belizean
Associate's Degree
Associate's Degree Comparison
Scandinavians
Belizeans
46.9%
ASSOCIATE'S DEGREE
65.2/ 100
METRIC RATING
161st/ 347
METRIC RANK
40.6%
ASSOCIATE'S DEGREE
0.1/ 100
METRIC RATING
272nd/ 347
METRIC RANK
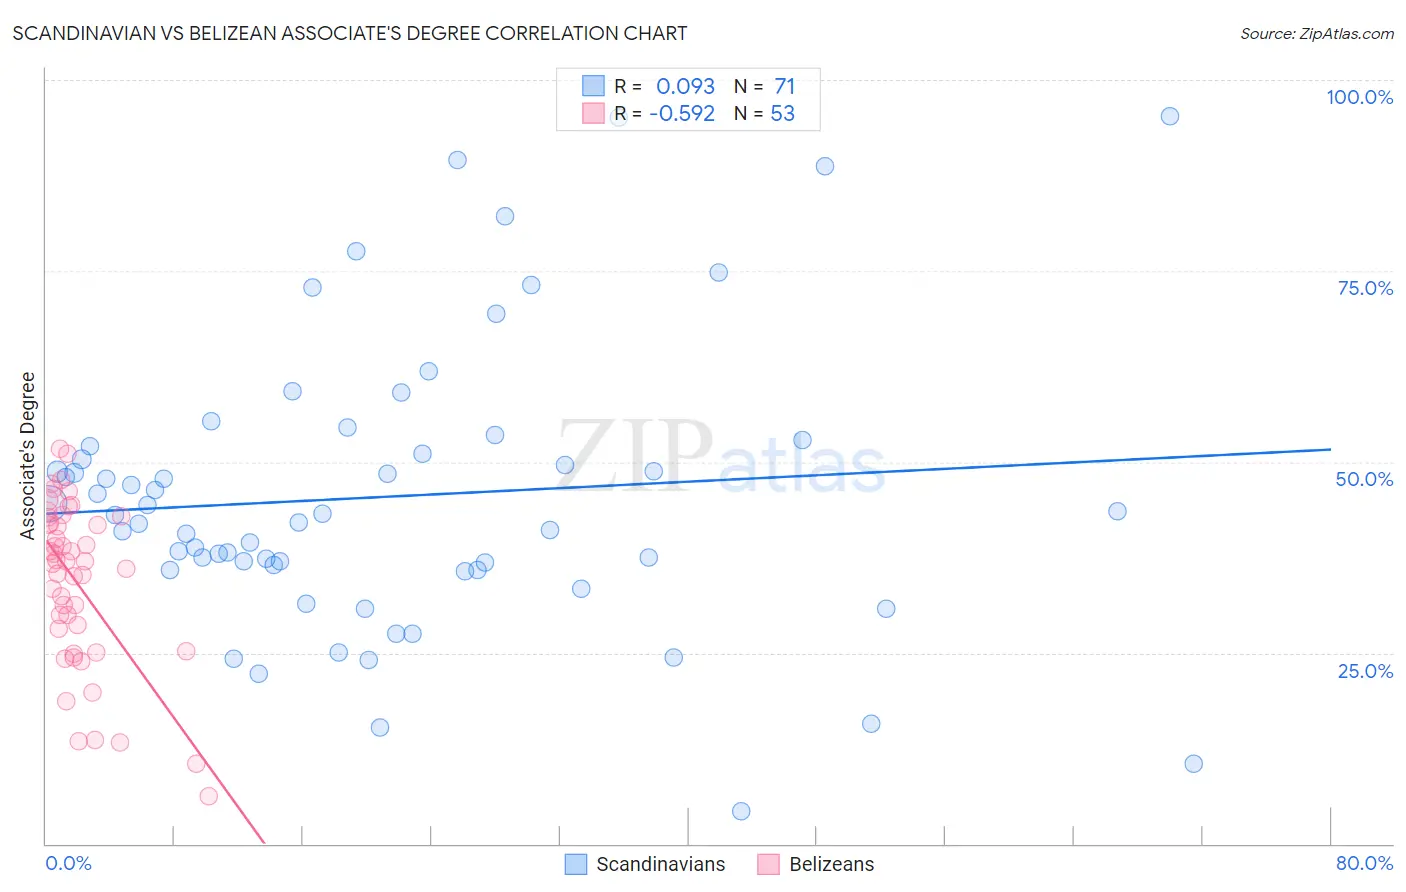
Scandinavian vs Belizean Associate's Degree Correlation Chart
The statistical analysis conducted on geographies consisting of 472,632,829 people shows a slight positive correlation between the proportion of Scandinavians and percentage of population with at least associate's degree education in the United States with a correlation coefficient (R) of 0.093 and weighted average of 46.9%. Similarly, the statistical analysis conducted on geographies consisting of 144,216,581 people shows a substantial negative correlation between the proportion of Belizeans and percentage of population with at least associate's degree education in the United States with a correlation coefficient (R) of -0.592 and weighted average of 40.6%, a difference of 15.4%.
Associate's Degree Correlation Summary
| Measurement | Scandinavian | Belizean |
| Minimum | 4.2% | 6.2% |
| Maximum | 95.2% | 51.7% |
| Range | 91.0% | 45.5% |
| Mean | 45.5% | 34.2% |
| Median | 43.1% | 37.0% |
| Interquartile 25% (IQ1) | 35.9% | 26.6% |
| Interquartile 75% (IQ3) | 52.1% | 42.4% |
| Interquartile Range (IQR) | 16.2% | 15.7% |
| Standard Deviation (Sample) | 18.8% | 10.8% |
| Standard Deviation (Population) | 18.7% | 10.7% |
Similar Demographics by Associate's Degree
Demographics Similar to Scandinavians by Associate's Degree
In terms of associate's degree, the demographic groups most similar to Scandinavians are Scottish (46.9%, a difference of 0.020%), Immigrants from Africa (46.8%, a difference of 0.16%), Somali (46.8%, a difference of 0.22%), Colombian (46.8%, a difference of 0.23%), and Immigrants from Poland (47.1%, a difference of 0.33%).
| Demographics | Rating | Rank | Associate's Degree |
| Immigrants | Kenya | 72.1 /100 | #154 | Good 47.2% |
| Kenyans | 70.6 /100 | #155 | Good 47.1% |
| South Americans | 70.5 /100 | #156 | Good 47.1% |
| Sudanese | 70.3 /100 | #157 | Good 47.1% |
| Immigrants | Germany | 69.7 /100 | #158 | Good 47.1% |
| Immigrants | Poland | 69.2 /100 | #159 | Good 47.1% |
| Scottish | 65.4 /100 | #160 | Good 46.9% |
| Scandinavians | 65.2 /100 | #161 | Good 46.9% |
| Immigrants | Africa | 63.2 /100 | #162 | Good 46.8% |
| Somalis | 62.5 /100 | #163 | Good 46.8% |
| Colombians | 62.4 /100 | #164 | Good 46.8% |
| Immigrants | South America | 59.9 /100 | #165 | Average 46.7% |
| Hungarians | 59.3 /100 | #166 | Average 46.7% |
| Immigrants | Sierra Leone | 59.2 /100 | #167 | Average 46.7% |
| Immigrants | Somalia | 55.5 /100 | #168 | Average 46.5% |
Demographics Similar to Belizeans by Associate's Degree
In terms of associate's degree, the demographic groups most similar to Belizeans are Immigrants from Laos (40.7%, a difference of 0.070%), Chippewa (40.7%, a difference of 0.25%), Puget Sound Salish (40.5%, a difference of 0.29%), American (40.8%, a difference of 0.30%), and Immigrants from Dominica (40.5%, a difference of 0.43%).
| Demographics | Rating | Rank | Associate's Degree |
| Africans | 0.2 /100 | #265 | Tragic 41.1% |
| Samoans | 0.2 /100 | #266 | Tragic 41.1% |
| Hawaiians | 0.2 /100 | #267 | Tragic 40.9% |
| Central American Indians | 0.2 /100 | #268 | Tragic 40.8% |
| Americans | 0.2 /100 | #269 | Tragic 40.8% |
| Chippewa | 0.2 /100 | #270 | Tragic 40.7% |
| Immigrants | Laos | 0.1 /100 | #271 | Tragic 40.7% |
| Belizeans | 0.1 /100 | #272 | Tragic 40.6% |
| Puget Sound Salish | 0.1 /100 | #273 | Tragic 40.5% |
| Immigrants | Dominica | 0.1 /100 | #274 | Tragic 40.5% |
| Potawatomi | 0.1 /100 | #275 | Tragic 40.4% |
| Puerto Ricans | 0.1 /100 | #276 | Tragic 40.4% |
| Blackfeet | 0.1 /100 | #277 | Tragic 40.3% |
| Ottawa | 0.1 /100 | #278 | Tragic 40.3% |
| Immigrants | Nicaragua | 0.1 /100 | #279 | Tragic 40.3% |