Sri Lankan vs Immigrants from Burma/Myanmar Associate's Degree
COMPARE
Sri Lankan
Immigrants from Burma/Myanmar
Associate's Degree
Associate's Degree Comparison
Sri Lankans
Immigrants from Burma/Myanmar
46.3%
ASSOCIATE'S DEGREE
47.6/ 100
METRIC RATING
179th/ 347
METRIC RANK
43.7%
ASSOCIATE'S DEGREE
4.3/ 100
METRIC RATING
226th/ 347
METRIC RANK
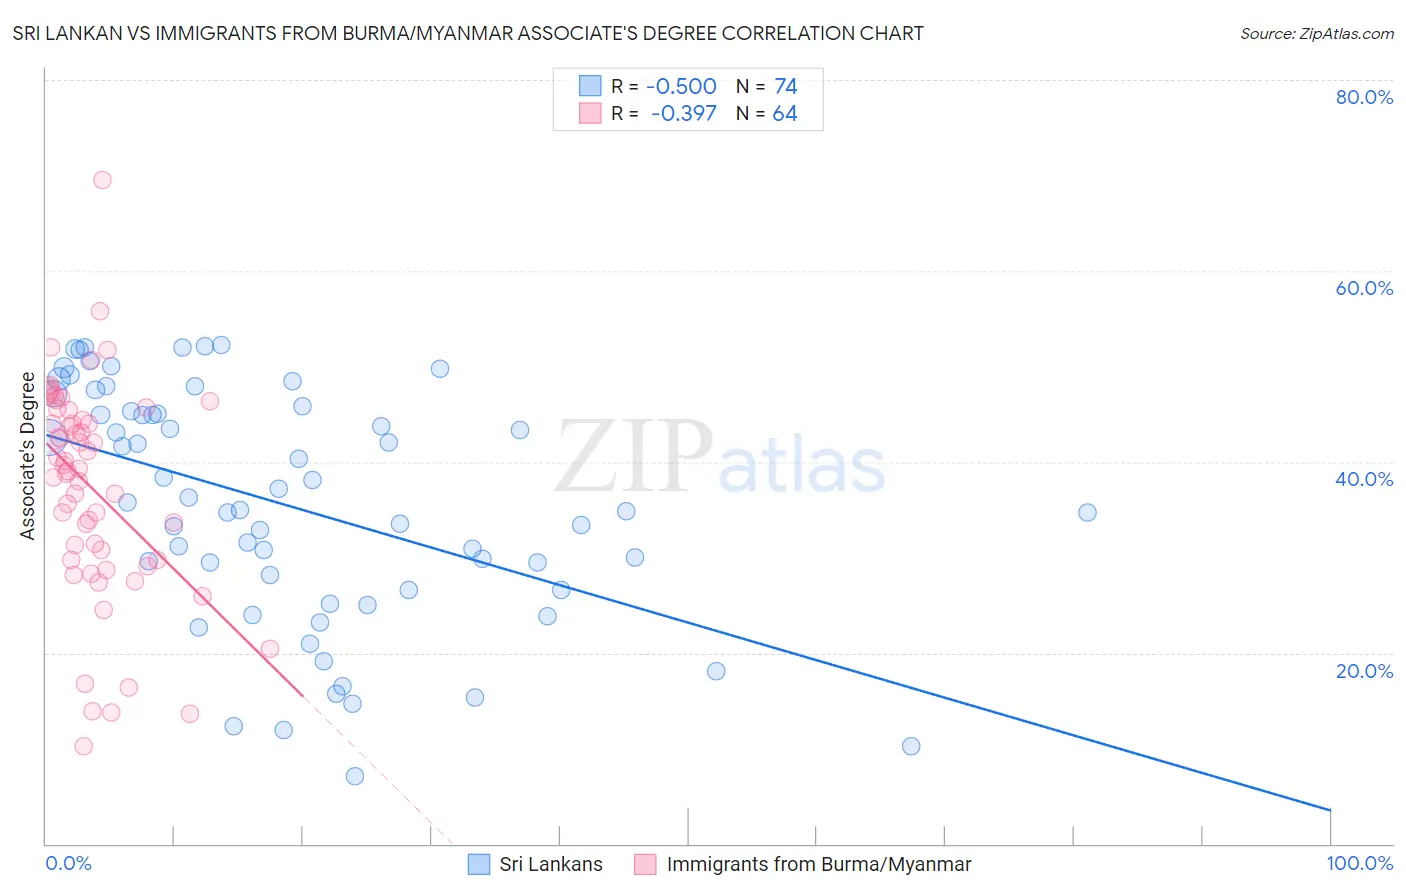
Sri Lankan vs Immigrants from Burma/Myanmar Associate's Degree Correlation Chart
The statistical analysis conducted on geographies consisting of 440,543,286 people shows a substantial negative correlation between the proportion of Sri Lankans and percentage of population with at least associate's degree education in the United States with a correlation coefficient (R) of -0.500 and weighted average of 46.3%. Similarly, the statistical analysis conducted on geographies consisting of 172,341,560 people shows a mild negative correlation between the proportion of Immigrants from Burma/Myanmar and percentage of population with at least associate's degree education in the United States with a correlation coefficient (R) of -0.397 and weighted average of 43.7%, a difference of 5.9%.
Associate's Degree Correlation Summary
| Measurement | Sri Lankan | Immigrants from Burma/Myanmar |
| Minimum | 7.0% | 10.2% |
| Maximum | 52.3% | 69.5% |
| Range | 45.3% | 59.3% |
| Mean | 35.4% | 37.2% |
| Median | 35.3% | 39.1% |
| Interquartile 25% (IQ1) | 26.6% | 29.7% |
| Interquartile 75% (IQ3) | 45.3% | 44.9% |
| Interquartile Range (IQR) | 18.7% | 15.2% |
| Standard Deviation (Sample) | 12.2% | 11.3% |
| Standard Deviation (Population) | 12.1% | 11.2% |
Similar Demographics by Associate's Degree
Demographics Similar to Sri Lankans by Associate's Degree
In terms of associate's degree, the demographic groups most similar to Sri Lankans are Immigrants from Bosnia and Herzegovina (46.3%, a difference of 0.050%), Slovak (46.3%, a difference of 0.060%), Finnish (46.3%, a difference of 0.070%), Bermudan (46.2%, a difference of 0.090%), and Belgian (46.3%, a difference of 0.10%).
| Demographics | Rating | Rank | Associate's Degree |
| Peruvians | 50.5 /100 | #172 | Average 46.4% |
| Immigrants | Iraq | 50.3 /100 | #173 | Average 46.4% |
| English | 50.0 /100 | #174 | Average 46.4% |
| Belgians | 48.9 /100 | #175 | Average 46.3% |
| Finns | 48.5 /100 | #176 | Average 46.3% |
| Slovaks | 48.4 /100 | #177 | Average 46.3% |
| Immigrants | Bosnia and Herzegovina | 48.3 /100 | #178 | Average 46.3% |
| Sri Lankans | 47.6 /100 | #179 | Average 46.3% |
| Bermudans | 46.4 /100 | #180 | Average 46.2% |
| Immigrants | Colombia | 41.3 /100 | #181 | Average 46.0% |
| Swiss | 40.4 /100 | #182 | Average 46.0% |
| Yugoslavians | 40.2 /100 | #183 | Average 46.0% |
| Czechoslovakians | 40.0 /100 | #184 | Average 46.0% |
| Costa Ricans | 38.6 /100 | #185 | Fair 46.0% |
| Welsh | 37.9 /100 | #186 | Fair 45.9% |
Demographics Similar to Immigrants from Burma/Myanmar by Associate's Degree
In terms of associate's degree, the demographic groups most similar to Immigrants from Burma/Myanmar are Trinidadian and Tobagonian (43.6%, a difference of 0.17%), Guamanian/Chamorro (43.8%, a difference of 0.22%), West Indian (43.8%, a difference of 0.37%), Subsaharan African (43.9%, a difference of 0.51%), and Barbadian (43.9%, a difference of 0.61%).
| Demographics | Rating | Rank | Associate's Degree |
| Whites/Caucasians | 7.5 /100 | #219 | Tragic 44.2% |
| Portuguese | 7.2 /100 | #220 | Tragic 44.1% |
| Immigrants | Western Africa | 6.6 /100 | #221 | Tragic 44.1% |
| Barbadians | 5.8 /100 | #222 | Tragic 43.9% |
| Sub-Saharan Africans | 5.5 /100 | #223 | Tragic 43.9% |
| West Indians | 5.2 /100 | #224 | Tragic 43.8% |
| Guamanians/Chamorros | 4.8 /100 | #225 | Tragic 43.8% |
| Immigrants | Burma/Myanmar | 4.3 /100 | #226 | Tragic 43.7% |
| Trinidadians and Tobagonians | 4.0 /100 | #227 | Tragic 43.6% |
| Hmong | 3.2 /100 | #228 | Tragic 43.4% |
| Immigrants | Trinidad and Tobago | 3.0 /100 | #229 | Tragic 43.3% |
| Immigrants | Barbados | 2.9 /100 | #230 | Tragic 43.3% |
| Liberians | 2.9 /100 | #231 | Tragic 43.3% |
| Native Hawaiians | 2.3 /100 | #232 | Tragic 43.1% |
| Tongans | 2.2 /100 | #233 | Tragic 43.0% |