Scandinavian vs Immigrants from Yemen Associate's Degree

COMPARE

Scandinavian
Race
Ancestry
AfghanAfricanAlaska NativeAlaskan AthabascanAlbanianAleutAlsatianAmericanApacheArabArapahoArgentineanArmenianAssyrian/Chaldean/SyriacAustralianAustrianBahamianBangladeshiBarbadianBasqueBelgianBelizeanBermudanBhutaneseBlackfeetBolivianBrazilianBritishBritish West IndianBulgarianBurmeseCajunCambodianCanadianCape VerdeanCarpatho RusynCelticCentral AmericanCentral American IndianCherokeeCheyenneChickasawChileanChineseChippewaChoctawColombianColvilleComancheCosta RicanCreeCreekCroatianCrowCubanCypriotCzechCzechoslovakianDanishDelawareDominicanDutchDutch West IndianEastern EuropeanEcuadorianEgyptianEnglishEstonianEthiopianEuropeanFijianFilipinoFinnishFrenchFrench American IndianFrench CanadianGermanGerman RussianGhanaianGreekGuamanian/ChamorroGuatemalanGuyaneseHaitianHmongHonduranHopiHoumaHungarianIcelanderIndian (Asian)IndonesianInupiatIranianIraqiIrishIroquoisIsraeliItalianJamaicanJapaneseJordanianKenyanKiowaKoreanLaotianLatvianLebaneseLiberianLithuanianLumbeeLuxembourgerMacedonianMalaysianMalteseMarshalleseMenomineeMexicanMexican American IndianMongolianMoroccanNative HawaiianNavajoNepaleseNew ZealanderNicaraguanNigerianNorthern EuropeanNorwegianOkinawanOsageOttawaPaiutePakistaniPalestinianPanamanianParaguayanPennsylvania GermanPeruvianPimaPolishPortuguesePotawatomiPuebloPuerto RicanPuget Sound SalishRomanianRussianSalvadoranSamoanScandinavianScotch-IrishScottishSeminoleSenegaleseSerbianShoshoneSierra LeoneanSiouxSlavicSlovakSloveneSomaliSouth AfricanSouth AmericanSouth American IndianSoviet UnionSpaniardSpanishSpanish AmericanSpanish American IndianSri LankanSubsaharan AfricanSudaneseSwedishSwissSyrianTaiwaneseThaiTlingit-HaidaTohono O'OdhamTonganTrinidadian and TobagonianTsimshianTurkishU.S. Virgin IslanderUgandanUkrainianUruguayanUteVenezuelanVietnameseWelshWest IndianYakamaYaquiYugoslavianYumanYup'ikZimbabwean
Immigration
NonimmigrantsImmigrantsAfghanistanAfricaAlbaniaArgentinaArmeniaAsiaAustraliaAustriaBahamasBangladeshBarbadosBelarusBelgiumBelizeBoliviaBosnia and HerzegovinaBrazilBulgariaBurma/MyanmarCabo VerdeCambodiaCameroonCanadaCaribbeanCentral AmericaChileChinaColombiaCongoCosta RicaCroatiaCubaCzechoslovakiaDenmarkDominicaDominican RepublicEastern AfricaEastern AsiaEastern EuropeEcuadorEgyptEl SalvadorEnglandEritreaEthiopiaEuropeFijiFranceGermanyGhanaGreeceGrenadaGuatemalaGuyanaHaitiHondurasHong KongHungaryIndiaIndonesiaIranIraqIrelandIsraelItalyJamaicaJapanJordanKazakhstanKenyaKoreaKuwaitLaosLatin AmericaLatviaLebanonLiberiaLithuaniaMalaysiaMexicoMicronesiaMiddle AfricaMoldovaMoroccoNepalNetherlandsNicaraguaNigeriaNorth AmericaNorth MacedoniaNorthern AfricaNorthern EuropeNorwayOceaniaPakistanPanamaPeruPhilippinesPolandPortugalRomaniaRussiaSaudi ArabiaScotlandSenegalSerbiaSierra LeoneSingaporeSomaliaSouth AfricaSouth AmericaSouth Central AsiaSouth Eastern AsiaSouthern EuropeSpainSri LankaSt. Vincent and the GrenadinesSudanSwedenSwitzerlandSyriaTaiwanThailandTrinidad and TobagoTurkeyUgandaUkraineUruguayUzbekistanVenezuelaVietnamWest IndiesWestern AfricaWestern AsiaWestern EuropeZaireZimbabweAzores
Immigrants from Yemen
Race
Ancestry
AfghanAfricanAlaska NativeAlaskan AthabascanAlbanianAleutAlsatianAmericanApacheArabArapahoArgentineanArmenianAssyrian/Chaldean/SyriacAustralianAustrianBahamianBangladeshiBarbadianBasqueBelgianBelizeanBermudanBhutaneseBlackfeetBolivianBrazilianBritishBritish West IndianBulgarianBurmeseCajunCambodianCanadianCape VerdeanCarpatho RusynCelticCentral AmericanCentral American IndianCherokeeCheyenneChickasawChileanChineseChippewaChoctawColombianColvilleComancheCosta RicanCreeCreekCroatianCrowCubanCypriotCzechCzechoslovakianDanishDelawareDominicanDutchDutch West IndianEastern EuropeanEcuadorianEgyptianEnglishEstonianEthiopianEuropeanFijianFilipinoFinnishFrenchFrench American IndianFrench CanadianGermanGerman RussianGhanaianGreekGuamanian/ChamorroGuatemalanGuyaneseHaitianHmongHonduranHopiHoumaHungarianIcelanderIndian (Asian)IndonesianInupiatIranianIraqiIrishIroquoisIsraeliItalianJamaicanJapaneseJordanianKenyanKiowaKoreanLaotianLatvianLebaneseLiberianLithuanianLumbeeLuxembourgerMacedonianMalaysianMalteseMarshalleseMenomineeMexicanMexican American IndianMongolianMoroccanNative HawaiianNavajoNepaleseNew ZealanderNicaraguanNigerianNorthern EuropeanNorwegianOkinawanOsageOttawaPaiutePakistaniPalestinianPanamanianParaguayanPennsylvania GermanPeruvianPimaPolishPortuguesePotawatomiPuebloPuerto RicanPuget Sound SalishRomanianRussianSalvadoranSamoanScotch-IrishScottishSeminoleSenegaleseSerbianShoshoneSierra LeoneanSiouxSlavicSlovakSloveneSomaliSouth AfricanSouth AmericanSouth American IndianSoviet UnionSpaniardSpanishSpanish AmericanSpanish American IndianSri LankanSubsaharan AfricanSudaneseSwedishSwissSyrianTaiwaneseThaiTlingit-HaidaTohono O'OdhamTonganTrinidadian and TobagonianTsimshianTurkishU.S. Virgin IslanderUgandanUkrainianUruguayanUteVenezuelanVietnameseWelshWest IndianYakamaYaquiYugoslavianYumanYup'ikZimbabwean
Immigration
NonimmigrantsImmigrantsAfghanistanAfricaAlbaniaArgentinaArmeniaAsiaAustraliaAustriaBahamasBangladeshBarbadosBelarusBelgiumBelizeBoliviaBosnia and HerzegovinaBrazilBulgariaBurma/MyanmarCabo VerdeCambodiaCameroonCanadaCaribbeanCentral AmericaChileChinaColombiaCongoCosta RicaCroatiaCubaCzechoslovakiaDenmarkDominicaDominican RepublicEastern AfricaEastern AsiaEastern EuropeEcuadorEgyptEl SalvadorEnglandEritreaEthiopiaEuropeFijiFranceGermanyGhanaGreeceGrenadaGuatemalaGuyanaHaitiHondurasHong KongHungaryIndiaIndonesiaIranIraqIrelandIsraelItalyJamaicaJapanJordanKazakhstanKenyaKoreaKuwaitLaosLatin AmericaLatviaLebanonLiberiaLithuaniaMalaysiaMexicoMicronesiaMiddle AfricaMoldovaMoroccoNepalNetherlandsNicaraguaNigeriaNorth AmericaNorth MacedoniaNorthern AfricaNorthern EuropeNorwayOceaniaPakistanPanamaPeruPhilippinesPolandPortugalRomaniaRussiaSaudi ArabiaScotlandSenegalSerbiaSierra LeoneSingaporeSomaliaSouth AfricaSouth AmericaSouth Central AsiaSouth Eastern AsiaSouthern EuropeSpainSri LankaSt. Vincent and the GrenadinesSudanSwedenSwitzerlandSyriaTaiwanThailandTrinidad and TobagoTurkeyUgandaUkraineUruguayUzbekistanVenezuelaVietnamWest IndiesWestern AfricaWestern AsiaWestern EuropeYemenZaireZimbabweAzores
Associate's Degree
Income
Poverty
Unemployment
Labor Participation
Family Structure
Vehicle Availability
Education Level
Disability

Associate's Degree Comparison

Scandinavians

Immigrants from Yemen

Good
Tragic
46.9%
ASSOCIATE'S DEGREE
65.2/ 100
METRIC RATING
161st/ 347
METRIC RANK
37.3%
ASSOCIATE'S DEGREE
0.0/ 100
METRIC RATING
321st/ 347
METRIC RANK

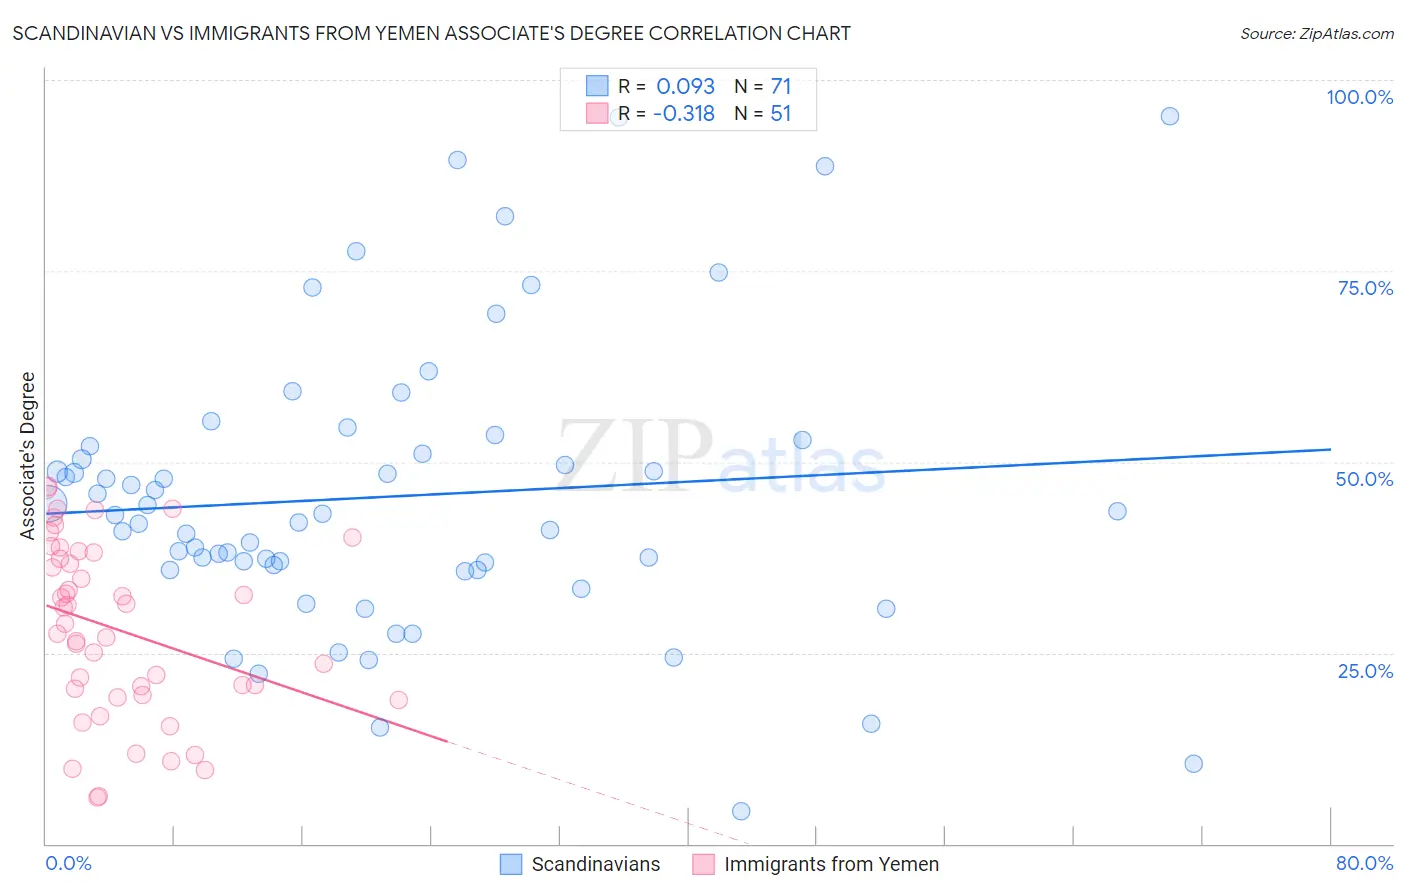
Scandinavian vs Immigrants from Yemen Associate's Degree Correlation Chart

The statistical analysis conducted on geographies consisting of 472,632,829 people shows a slight positive correlation between the proportion of Scandinavians and percentage of population with at least associate's degree education in the United States with a correlation coefficient (R) of 0.093 and weighted average of 46.9%. Similarly, the statistical analysis conducted on geographies consisting of 82,433,611 people shows a mild negative correlation between the proportion of Immigrants from Yemen and percentage of population with at least associate's degree education in the United States with a correlation coefficient (R) of -0.318 and weighted average of 37.3%, a difference of 25.7%.
Scandinavian vs Immigrants from Yemen Associate's Degree

Associate's Degree Correlation Summary

MeasurementScandinavianImmigrants from Yemen
Minimum4.2%6.0%
Maximum95.2%46.7%
Range91.0%40.7%
Mean45.5%28.0%
Median43.1%28.8%
Interquartile 25% (IQ1)35.9%19.5%
Interquartile 75% (IQ3)52.1%38.1%
Interquartile Range (IQR)16.2%18.6%
Standard Deviation (Sample)18.8%11.4%
Standard Deviation (Population)18.7%11.3%

Similar Demographics by Associate's Degree

Demographics Similar to Scandinavians by Associate's Degree

In terms of associate's degree, the demographic groups most similar to Scandinavians are Scottish (46.9%, a difference of 0.020%), Immigrants from Africa (46.8%, a difference of 0.16%), Somali (46.8%, a difference of 0.22%), Colombian (46.8%, a difference of 0.23%), and Immigrants from Poland (47.1%, a difference of 0.33%).
DemographicsRating | RankAssociate's Degree
Immigrants | Kenya
72.1
/100
|
#154
Good
47.2%
Kenyans
70.6
/100
|
#155
Good
47.1%
South Americans
70.5
/100
|
#156
Good
47.1%
Sudanese
70.3
/100
|
#157
Good
47.1%
Immigrants | Germany
69.7
/100
|
#158
Good
47.1%
Immigrants | Poland
69.2
/100
|
#159
Good
47.1%
Scottish
65.4
/100
|
#160
Good
46.9%
Scandinavians
65.2
/100
|
#161
Good
46.9%
Immigrants | Africa
63.2
/100
|
#162
Good
46.8%
Somalis
62.5
/100
|
#163
Good
46.8%
Colombians
62.4
/100
|
#164
Good
46.8%
Immigrants | South America
59.9
/100
|
#165
Average
46.7%
Hungarians
59.3
/100
|
#166
Average
46.7%
Immigrants | Sierra Leone
59.2
/100
|
#167
Average
46.7%
Immigrants | Somalia
55.5
/100
|
#168
Average
46.5%

Demographics Similar to Immigrants from Yemen by Associate's Degree

In terms of associate's degree, the demographic groups most similar to Immigrants from Yemen are Cajun (37.4%, a difference of 0.12%), Fijian (37.4%, a difference of 0.15%), Pennsylvania German (37.2%, a difference of 0.29%), Alaska Native (37.5%, a difference of 0.37%), and Yaqui (37.6%, a difference of 0.60%).
DemographicsRating | RankAssociate's Degree
Seminole
0.0
/100
|
#314
Tragic
37.7%
Creek
0.0
/100
|
#315
Tragic
37.6%
Crow
0.0
/100
|
#316
Tragic
37.6%
Yaqui
0.0
/100
|
#317
Tragic
37.6%
Alaska Natives
0.0
/100
|
#318
Tragic
37.5%
Fijians
0.0
/100
|
#319
Tragic
37.4%
Cajuns
0.0
/100
|
#320
Tragic
37.4%
Immigrants | Yemen
0.0
/100
|
#321
Tragic
37.3%
Pennsylvania Germans
0.0
/100
|
#322
Tragic
37.2%
Immigrants | Cabo Verde
0.0
/100
|
#323
Tragic
36.8%
Arapaho
0.0
/100
|
#324
Tragic
36.7%
Menominee
0.0
/100
|
#325
Tragic
36.7%
Kiowa
0.0
/100
|
#326
Tragic
36.5%
Dutch West Indians
0.0
/100
|
#327
Tragic
36.5%
Alaskan Athabascans
0.0
/100
|
#328
Tragic
36.5%