Immigrants from Micronesia vs Immigrants from Burma/Myanmar Associate's Degree
COMPARE
Immigrants from Micronesia
Immigrants from Burma/Myanmar
Associate's Degree
Associate's Degree Comparison
Immigrants from Micronesia
Immigrants from Burma/Myanmar
40.2%
ASSOCIATE'S DEGREE
0.1/ 100
METRIC RATING
280th/ 347
METRIC RANK
43.7%
ASSOCIATE'S DEGREE
4.3/ 100
METRIC RATING
226th/ 347
METRIC RANK
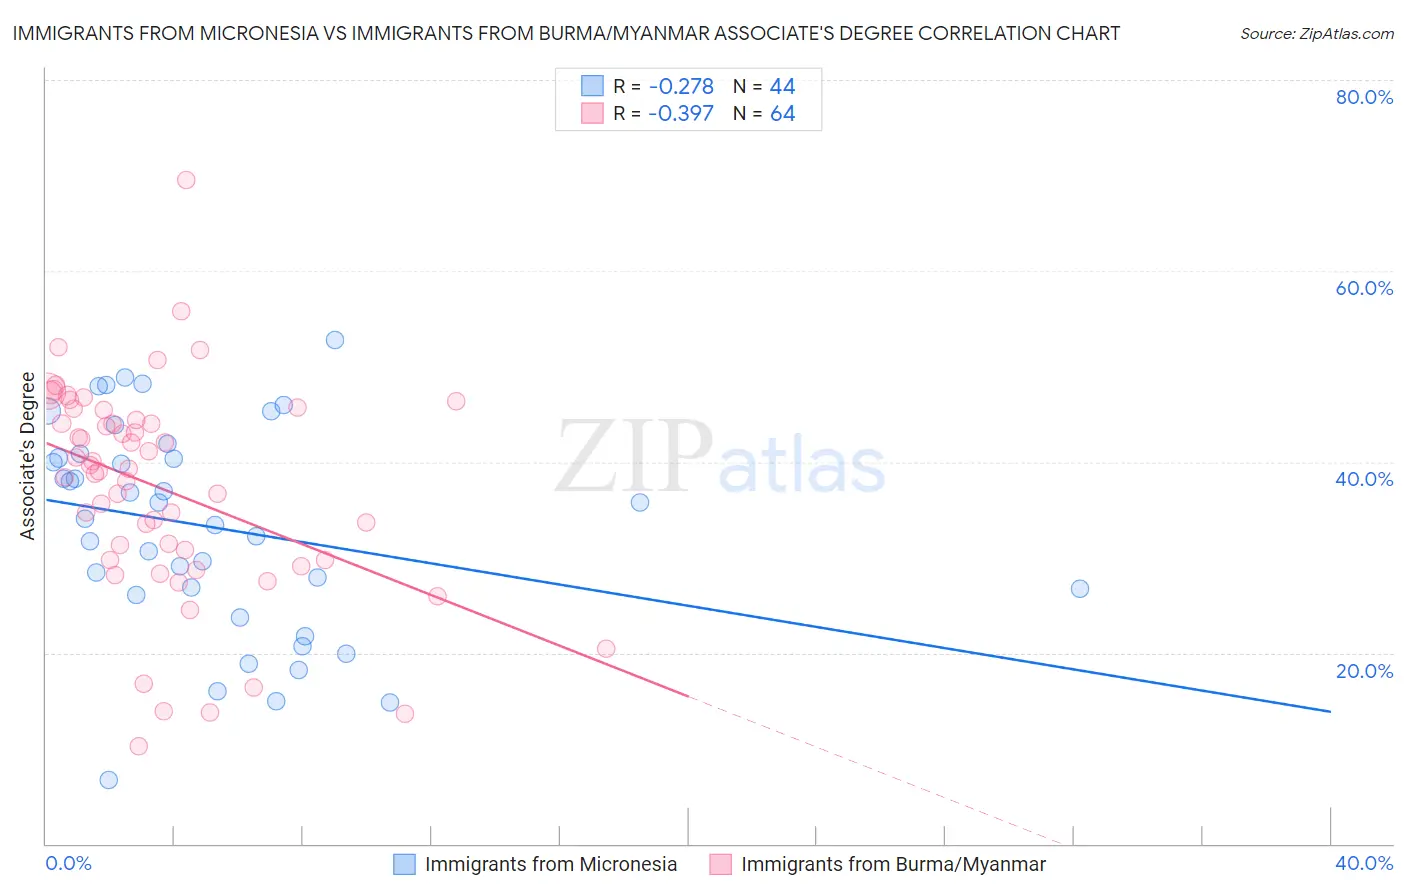
Immigrants from Micronesia vs Immigrants from Burma/Myanmar Associate's Degree Correlation Chart
The statistical analysis conducted on geographies consisting of 61,609,499 people shows a weak negative correlation between the proportion of Immigrants from Micronesia and percentage of population with at least associate's degree education in the United States with a correlation coefficient (R) of -0.278 and weighted average of 40.2%. Similarly, the statistical analysis conducted on geographies consisting of 172,341,560 people shows a mild negative correlation between the proportion of Immigrants from Burma/Myanmar and percentage of population with at least associate's degree education in the United States with a correlation coefficient (R) of -0.397 and weighted average of 43.7%, a difference of 8.7%.
Associate's Degree Correlation Summary
| Measurement | Immigrants from Micronesia | Immigrants from Burma/Myanmar |
| Minimum | 6.6% | 10.2% |
| Maximum | 52.7% | 69.5% |
| Range | 46.1% | 59.3% |
| Mean | 33.2% | 37.2% |
| Median | 34.9% | 39.1% |
| Interquartile 25% (IQ1) | 26.4% | 29.7% |
| Interquartile 75% (IQ3) | 40.6% | 44.9% |
| Interquartile Range (IQR) | 14.2% | 15.2% |
| Standard Deviation (Sample) | 11.0% | 11.3% |
| Standard Deviation (Population) | 10.9% | 11.2% |
Similar Demographics by Associate's Degree
Demographics Similar to Immigrants from Micronesia by Associate's Degree
In terms of associate's degree, the demographic groups most similar to Immigrants from Micronesia are Immigrants from Portugal (40.1%, a difference of 0.10%), Immigrants from Nicaragua (40.3%, a difference of 0.20%), Ottawa (40.3%, a difference of 0.24%), Blackfeet (40.3%, a difference of 0.39%), and Bangladeshi (40.0%, a difference of 0.41%).
| Demographics | Rating | Rank | Associate's Degree |
| Puget Sound Salish | 0.1 /100 | #273 | Tragic 40.5% |
| Immigrants | Dominica | 0.1 /100 | #274 | Tragic 40.5% |
| Potawatomi | 0.1 /100 | #275 | Tragic 40.4% |
| Puerto Ricans | 0.1 /100 | #276 | Tragic 40.4% |
| Blackfeet | 0.1 /100 | #277 | Tragic 40.3% |
| Ottawa | 0.1 /100 | #278 | Tragic 40.3% |
| Immigrants | Nicaragua | 0.1 /100 | #279 | Tragic 40.3% |
| Immigrants | Micronesia | 0.1 /100 | #280 | Tragic 40.2% |
| Immigrants | Portugal | 0.1 /100 | #281 | Tragic 40.1% |
| Bangladeshis | 0.1 /100 | #282 | Tragic 40.0% |
| Haitians | 0.1 /100 | #283 | Tragic 40.0% |
| Comanche | 0.1 /100 | #284 | Tragic 39.9% |
| Immigrants | Belize | 0.1 /100 | #285 | Tragic 39.9% |
| Immigrants | Caribbean | 0.0 /100 | #286 | Tragic 39.7% |
| Aleuts | 0.0 /100 | #287 | Tragic 39.6% |
Demographics Similar to Immigrants from Burma/Myanmar by Associate's Degree
In terms of associate's degree, the demographic groups most similar to Immigrants from Burma/Myanmar are Trinidadian and Tobagonian (43.6%, a difference of 0.17%), Guamanian/Chamorro (43.8%, a difference of 0.22%), West Indian (43.8%, a difference of 0.37%), Subsaharan African (43.9%, a difference of 0.51%), and Barbadian (43.9%, a difference of 0.61%).
| Demographics | Rating | Rank | Associate's Degree |
| Whites/Caucasians | 7.5 /100 | #219 | Tragic 44.2% |
| Portuguese | 7.2 /100 | #220 | Tragic 44.1% |
| Immigrants | Western Africa | 6.6 /100 | #221 | Tragic 44.1% |
| Barbadians | 5.8 /100 | #222 | Tragic 43.9% |
| Sub-Saharan Africans | 5.5 /100 | #223 | Tragic 43.9% |
| West Indians | 5.2 /100 | #224 | Tragic 43.8% |
| Guamanians/Chamorros | 4.8 /100 | #225 | Tragic 43.8% |
| Immigrants | Burma/Myanmar | 4.3 /100 | #226 | Tragic 43.7% |
| Trinidadians and Tobagonians | 4.0 /100 | #227 | Tragic 43.6% |
| Hmong | 3.2 /100 | #228 | Tragic 43.4% |
| Immigrants | Trinidad and Tobago | 3.0 /100 | #229 | Tragic 43.3% |
| Immigrants | Barbados | 2.9 /100 | #230 | Tragic 43.3% |
| Liberians | 2.9 /100 | #231 | Tragic 43.3% |
| Native Hawaiians | 2.3 /100 | #232 | Tragic 43.1% |
| Tongans | 2.2 /100 | #233 | Tragic 43.0% |