Scandinavian vs Delaware Associate's Degree
COMPARE
Scandinavian
Delaware
Associate's Degree
Associate's Degree Comparison
Scandinavians
Delaware
46.9%
ASSOCIATE'S DEGREE
65.2/ 100
METRIC RATING
161st/ 347
METRIC RANK
42.3%
ASSOCIATE'S DEGREE
0.9/ 100
METRIC RATING
246th/ 347
METRIC RANK
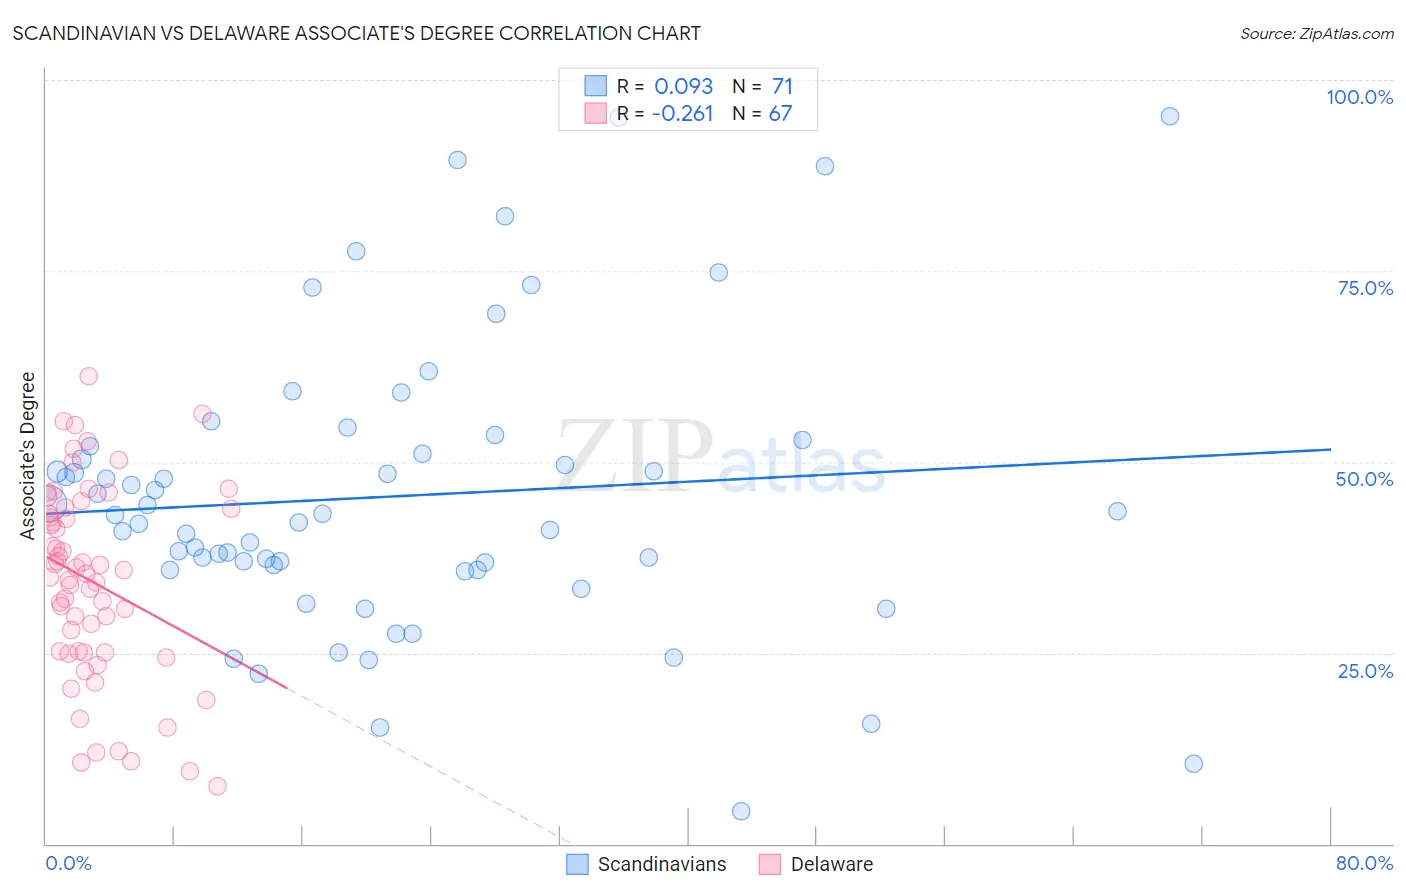
Scandinavian vs Delaware Associate's Degree Correlation Chart
The statistical analysis conducted on geographies consisting of 472,632,829 people shows a slight positive correlation between the proportion of Scandinavians and percentage of population with at least associate's degree education in the United States with a correlation coefficient (R) of 0.093 and weighted average of 46.9%. Similarly, the statistical analysis conducted on geographies consisting of 96,235,380 people shows a weak negative correlation between the proportion of Delaware and percentage of population with at least associate's degree education in the United States with a correlation coefficient (R) of -0.261 and weighted average of 42.3%, a difference of 11.0%.
Associate's Degree Correlation Summary
| Measurement | Scandinavian | Delaware |
| Minimum | 4.2% | 7.5% |
| Maximum | 95.2% | 61.3% |
| Range | 91.0% | 53.7% |
| Mean | 45.5% | 34.3% |
| Median | 43.1% | 35.3% |
| Interquartile 25% (IQ1) | 35.9% | 25.0% |
| Interquartile 75% (IQ3) | 52.1% | 43.8% |
| Interquartile Range (IQR) | 16.2% | 18.8% |
| Standard Deviation (Sample) | 18.8% | 12.6% |
| Standard Deviation (Population) | 18.7% | 12.5% |
Similar Demographics by Associate's Degree
Demographics Similar to Scandinavians by Associate's Degree
In terms of associate's degree, the demographic groups most similar to Scandinavians are Scottish (46.9%, a difference of 0.020%), Immigrants from Africa (46.8%, a difference of 0.16%), Somali (46.8%, a difference of 0.22%), Colombian (46.8%, a difference of 0.23%), and Immigrants from Poland (47.1%, a difference of 0.33%).
| Demographics | Rating | Rank | Associate's Degree |
| Immigrants | Kenya | 72.1 /100 | #154 | Good 47.2% |
| Kenyans | 70.6 /100 | #155 | Good 47.1% |
| South Americans | 70.5 /100 | #156 | Good 47.1% |
| Sudanese | 70.3 /100 | #157 | Good 47.1% |
| Immigrants | Germany | 69.7 /100 | #158 | Good 47.1% |
| Immigrants | Poland | 69.2 /100 | #159 | Good 47.1% |
| Scottish | 65.4 /100 | #160 | Good 46.9% |
| Scandinavians | 65.2 /100 | #161 | Good 46.9% |
| Immigrants | Africa | 63.2 /100 | #162 | Good 46.8% |
| Somalis | 62.5 /100 | #163 | Good 46.8% |
| Colombians | 62.4 /100 | #164 | Good 46.8% |
| Immigrants | South America | 59.9 /100 | #165 | Average 46.7% |
| Hungarians | 59.3 /100 | #166 | Average 46.7% |
| Immigrants | Sierra Leone | 59.2 /100 | #167 | Average 46.7% |
| Immigrants | Somalia | 55.5 /100 | #168 | Average 46.5% |
Demographics Similar to Delaware by Associate's Degree
In terms of associate's degree, the demographic groups most similar to Delaware are Immigrants from Cambodia (42.3%, a difference of 0.030%), Immigrants from Liberia (42.3%, a difference of 0.050%), Immigrants from Fiji (42.2%, a difference of 0.090%), Immigrants from Ecuador (42.2%, a difference of 0.18%), and Guyanese (42.3%, a difference of 0.19%).
| Demographics | Rating | Rank | Associate's Degree |
| Immigrants | Grenada | 1.3 /100 | #239 | Tragic 42.6% |
| Cree | 1.2 /100 | #240 | Tragic 42.5% |
| British West Indians | 1.0 /100 | #241 | Tragic 42.4% |
| Immigrants | West Indies | 1.0 /100 | #242 | Tragic 42.4% |
| Guyanese | 1.0 /100 | #243 | Tragic 42.3% |
| Immigrants | Liberia | 0.9 /100 | #244 | Tragic 42.3% |
| Immigrants | Cambodia | 0.9 /100 | #245 | Tragic 42.3% |
| Delaware | 0.9 /100 | #246 | Tragic 42.3% |
| Immigrants | Fiji | 0.8 /100 | #247 | Tragic 42.2% |
| Immigrants | Ecuador | 0.8 /100 | #248 | Tragic 42.2% |
| Jamaicans | 0.7 /100 | #249 | Tragic 42.1% |
| U.S. Virgin Islanders | 0.7 /100 | #250 | Tragic 42.1% |
| Immigrants | Bahamas | 0.7 /100 | #251 | Tragic 42.1% |
| French American Indians | 0.6 /100 | #252 | Tragic 42.0% |
| Indonesians | 0.6 /100 | #253 | Tragic 41.9% |