Scandinavian vs Arab Associate's Degree
COMPARE
Scandinavian
Arab
Associate's Degree
Associate's Degree Comparison
Scandinavians
Arabs
46.9%
ASSOCIATE'S DEGREE
65.2/ 100
METRIC RATING
161st/ 347
METRIC RANK
49.0%
ASSOCIATE'S DEGREE
95.3/ 100
METRIC RATING
114th/ 347
METRIC RANK
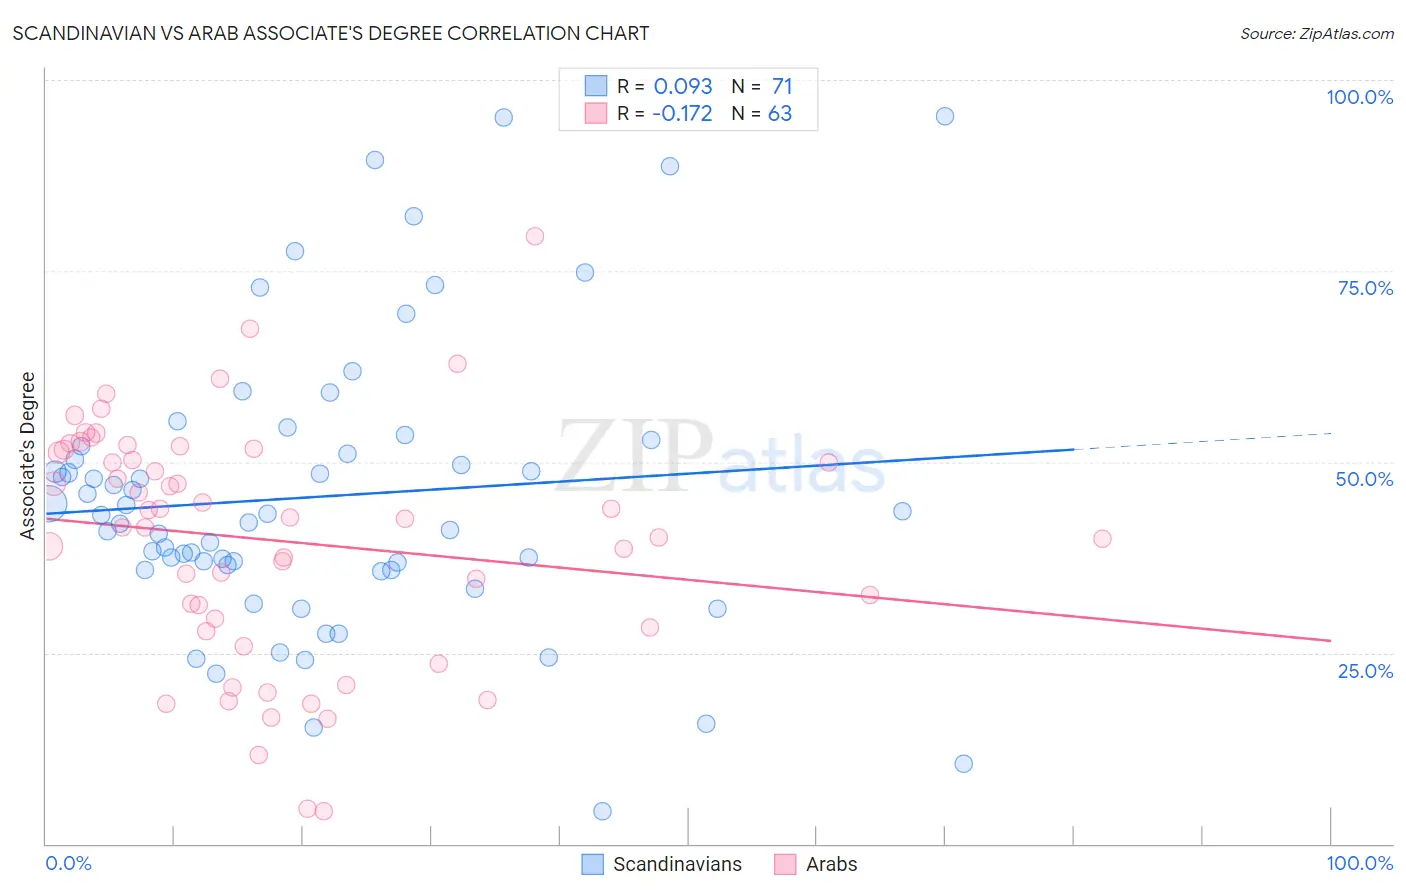
Scandinavian vs Arab Associate's Degree Correlation Chart
The statistical analysis conducted on geographies consisting of 472,632,829 people shows a slight positive correlation between the proportion of Scandinavians and percentage of population with at least associate's degree education in the United States with a correlation coefficient (R) of 0.093 and weighted average of 46.9%. Similarly, the statistical analysis conducted on geographies consisting of 486,836,450 people shows a poor negative correlation between the proportion of Arabs and percentage of population with at least associate's degree education in the United States with a correlation coefficient (R) of -0.172 and weighted average of 49.0%, a difference of 4.4%.
Associate's Degree Correlation Summary
| Measurement | Scandinavian | Arab |
| Minimum | 4.2% | 4.3% |
| Maximum | 95.2% | 79.5% |
| Range | 91.0% | 75.3% |
| Mean | 45.5% | 39.7% |
| Median | 43.1% | 42.6% |
| Interquartile 25% (IQ1) | 35.9% | 28.4% |
| Interquartile 75% (IQ3) | 52.1% | 51.6% |
| Interquartile Range (IQR) | 16.2% | 23.3% |
| Standard Deviation (Sample) | 18.8% | 15.6% |
| Standard Deviation (Population) | 18.7% | 15.5% |
Similar Demographics by Associate's Degree
Demographics Similar to Scandinavians by Associate's Degree
In terms of associate's degree, the demographic groups most similar to Scandinavians are Scottish (46.9%, a difference of 0.020%), Immigrants from Africa (46.8%, a difference of 0.16%), Somali (46.8%, a difference of 0.22%), Colombian (46.8%, a difference of 0.23%), and Immigrants from Poland (47.1%, a difference of 0.33%).
| Demographics | Rating | Rank | Associate's Degree |
| Immigrants | Kenya | 72.1 /100 | #154 | Good 47.2% |
| Kenyans | 70.6 /100 | #155 | Good 47.1% |
| South Americans | 70.5 /100 | #156 | Good 47.1% |
| Sudanese | 70.3 /100 | #157 | Good 47.1% |
| Immigrants | Germany | 69.7 /100 | #158 | Good 47.1% |
| Immigrants | Poland | 69.2 /100 | #159 | Good 47.1% |
| Scottish | 65.4 /100 | #160 | Good 46.9% |
| Scandinavians | 65.2 /100 | #161 | Good 46.9% |
| Immigrants | Africa | 63.2 /100 | #162 | Good 46.8% |
| Somalis | 62.5 /100 | #163 | Good 46.8% |
| Colombians | 62.4 /100 | #164 | Good 46.8% |
| Immigrants | South America | 59.9 /100 | #165 | Average 46.7% |
| Hungarians | 59.3 /100 | #166 | Average 46.7% |
| Immigrants | Sierra Leone | 59.2 /100 | #167 | Average 46.7% |
| Immigrants | Somalia | 55.5 /100 | #168 | Average 46.5% |
Demographics Similar to Arabs by Associate's Degree
In terms of associate's degree, the demographic groups most similar to Arabs are Immigrants from Chile (49.0%, a difference of 0.0%), Palestinian (49.0%, a difference of 0.0%), Luxembourger (48.9%, a difference of 0.070%), British (48.9%, a difference of 0.13%), and Afghan (48.9%, a difference of 0.18%).
| Demographics | Rating | Rank | Associate's Degree |
| Syrians | 96.7 /100 | #107 | Exceptional 49.3% |
| Jordanians | 96.6 /100 | #108 | Exceptional 49.2% |
| Immigrants | Morocco | 96.3 /100 | #109 | Exceptional 49.2% |
| Austrians | 95.8 /100 | #110 | Exceptional 49.1% |
| Immigrants | Venezuela | 95.8 /100 | #111 | Exceptional 49.1% |
| Immigrants | Chile | 95.3 /100 | #112 | Exceptional 49.0% |
| Palestinians | 95.3 /100 | #113 | Exceptional 49.0% |
| Arabs | 95.3 /100 | #114 | Exceptional 49.0% |
| Luxembourgers | 95.1 /100 | #115 | Exceptional 48.9% |
| British | 95.0 /100 | #116 | Exceptional 48.9% |
| Afghans | 94.8 /100 | #117 | Exceptional 48.9% |
| Albanians | 94.7 /100 | #118 | Exceptional 48.8% |
| Lebanese | 94.6 /100 | #119 | Exceptional 48.8% |
| Alsatians | 94.6 /100 | #120 | Exceptional 48.8% |
| Ugandans | 93.9 /100 | #121 | Exceptional 48.7% |