Scandinavian vs Immigrants from Burma/Myanmar Unemployment Among Youth under 25 years
COMPARE
Scandinavian
Immigrants from Burma/Myanmar
Unemployment Among Youth under 25 years
Unemployment Among Youth under 25 years Comparison
Scandinavians
Immigrants from Burma/Myanmar
10.5%
UNEMPLOYMENT AMONG YOUTH UNDER 25 YEARS
100.0/ 100
METRIC RATING
11th/ 347
METRIC RANK
10.6%
UNEMPLOYMENT AMONG YOUTH UNDER 25 YEARS
100.0/ 100
METRIC RATING
19th/ 347
METRIC RANK
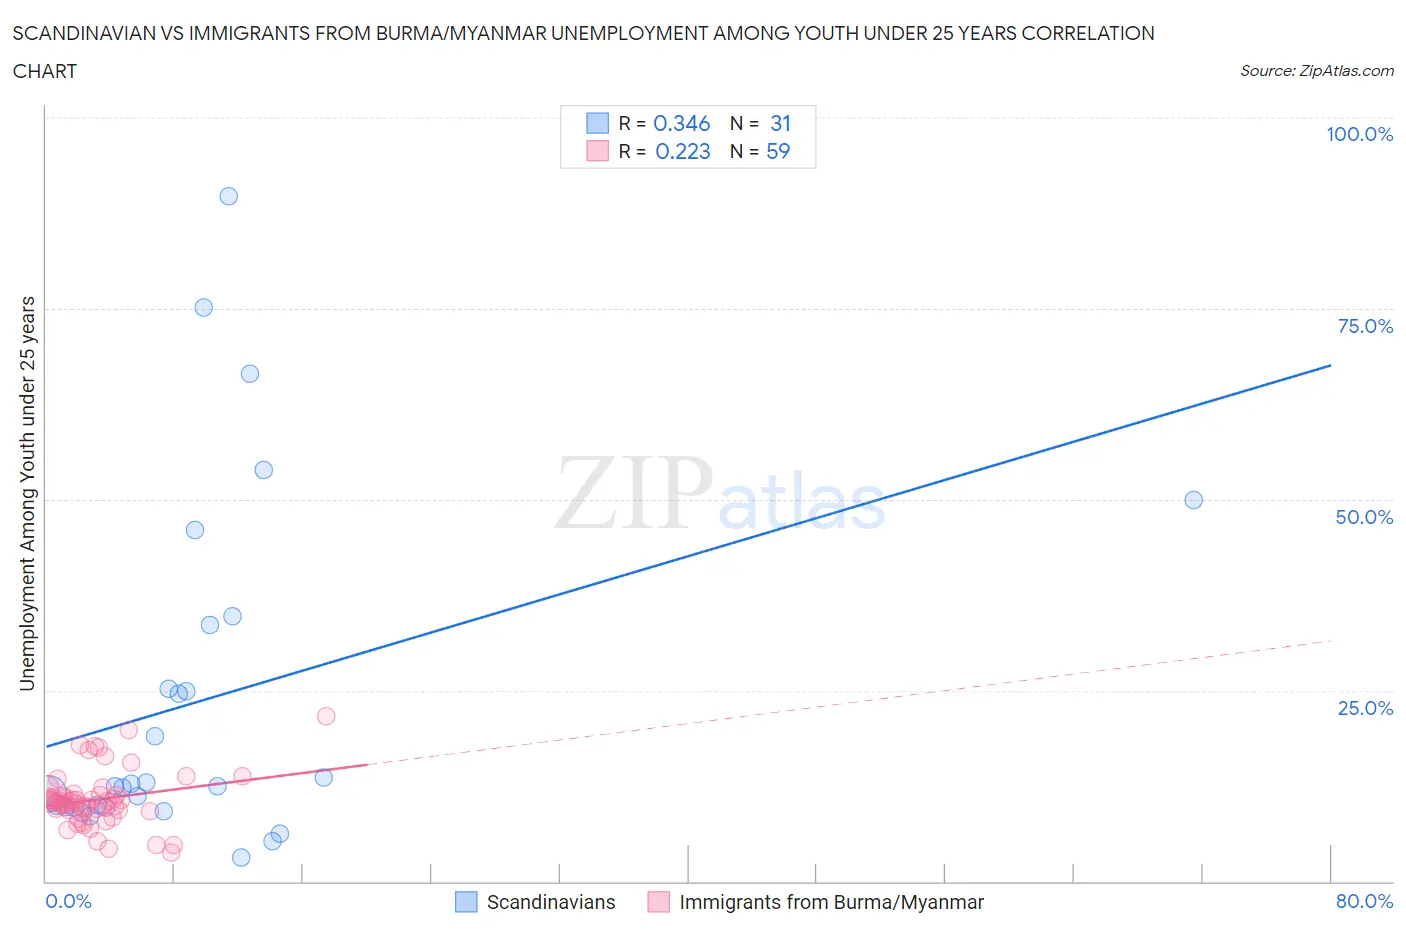
Scandinavian vs Immigrants from Burma/Myanmar Unemployment Among Youth under 25 years Correlation Chart
The statistical analysis conducted on geographies consisting of 460,589,889 people shows a mild positive correlation between the proportion of Scandinavians and unemployment rate among youth under the age of 25 in the United States with a correlation coefficient (R) of 0.346 and weighted average of 10.5%. Similarly, the statistical analysis conducted on geographies consisting of 171,764,683 people shows a weak positive correlation between the proportion of Immigrants from Burma/Myanmar and unemployment rate among youth under the age of 25 in the United States with a correlation coefficient (R) of 0.223 and weighted average of 10.6%, a difference of 0.66%.
Unemployment Among Youth under 25 years Correlation Summary
| Measurement | Scandinavian | Immigrants from Burma/Myanmar |
| Minimum | 3.1% | 3.7% |
| Maximum | 89.7% | 21.6% |
| Range | 86.6% | 17.9% |
| Mean | 23.6% | 10.7% |
| Median | 12.5% | 10.4% |
| Interquartile 25% (IQ1) | 9.7% | 9.4% |
| Interquartile 75% (IQ3) | 33.6% | 11.3% |
| Interquartile Range (IQR) | 23.9% | 1.9% |
| Standard Deviation (Sample) | 22.3% | 3.6% |
| Standard Deviation (Population) | 21.9% | 3.6% |
Demographics Similar to Scandinavians and Immigrants from Burma/Myanmar by Unemployment Among Youth under 25 years
In terms of unemployment among youth under 25 years, the demographic groups most similar to Scandinavians are Immigrants from Somalia (10.5%, a difference of 0.13%), German (10.5%, a difference of 0.15%), Immigrants from Sudan (10.5%, a difference of 0.18%), Indonesian (10.6%, a difference of 0.30%), and Cuban (10.6%, a difference of 0.32%). Similarly, the demographic groups most similar to Immigrants from Burma/Myanmar are Swiss (10.6%, a difference of 0.010%), Dutch (10.6%, a difference of 0.020%), Menominee (10.6%, a difference of 0.17%), Sudanese (10.6%, a difference of 0.22%), and Venezuelan (10.6%, a difference of 0.22%).
| Demographics | Rating | Rank | Unemployment Among Youth under 25 years |
| Czechs | 100.0 /100 | #5 | Exceptional 10.3% |
| Danes | 100.0 /100 | #6 | Exceptional 10.3% |
| Swedes | 100.0 /100 | #7 | Exceptional 10.4% |
| Immigrants | Venezuela | 100.0 /100 | #8 | Exceptional 10.5% |
| Germans | 100.0 /100 | #9 | Exceptional 10.5% |
| Immigrants | Somalia | 100.0 /100 | #10 | Exceptional 10.5% |
| Scandinavians | 100.0 /100 | #11 | Exceptional 10.5% |
| Immigrants | Sudan | 100.0 /100 | #12 | Exceptional 10.5% |
| Indonesians | 100.0 /100 | #13 | Exceptional 10.6% |
| Cubans | 100.0 /100 | #14 | Exceptional 10.6% |
| Sudanese | 100.0 /100 | #15 | Exceptional 10.6% |
| Venezuelans | 100.0 /100 | #16 | Exceptional 10.6% |
| Menominee | 100.0 /100 | #17 | Exceptional 10.6% |
| Swiss | 100.0 /100 | #18 | Exceptional 10.6% |
| Immigrants | Burma/Myanmar | 100.0 /100 | #19 | Exceptional 10.6% |
| Dutch | 100.0 /100 | #20 | Exceptional 10.6% |
| Pennsylvania Germans | 100.0 /100 | #21 | Exceptional 10.6% |
| Belgians | 100.0 /100 | #22 | Exceptional 10.6% |
| Immigrants | Bosnia and Herzegovina | 100.0 /100 | #23 | Exceptional 10.6% |
| Finns | 100.0 /100 | #24 | Exceptional 10.7% |
| Immigrants | North Macedonia | 100.0 /100 | #25 | Exceptional 10.7% |