Immigrants from England vs Delaware Associate's Degree
COMPARE
Immigrants from England
Delaware
Associate's Degree
Associate's Degree Comparison
Immigrants from England
Delaware
49.7%
ASSOCIATE'S DEGREE
98.0/ 100
METRIC RATING
95th/ 347
METRIC RANK
42.3%
ASSOCIATE'S DEGREE
0.9/ 100
METRIC RATING
246th/ 347
METRIC RANK
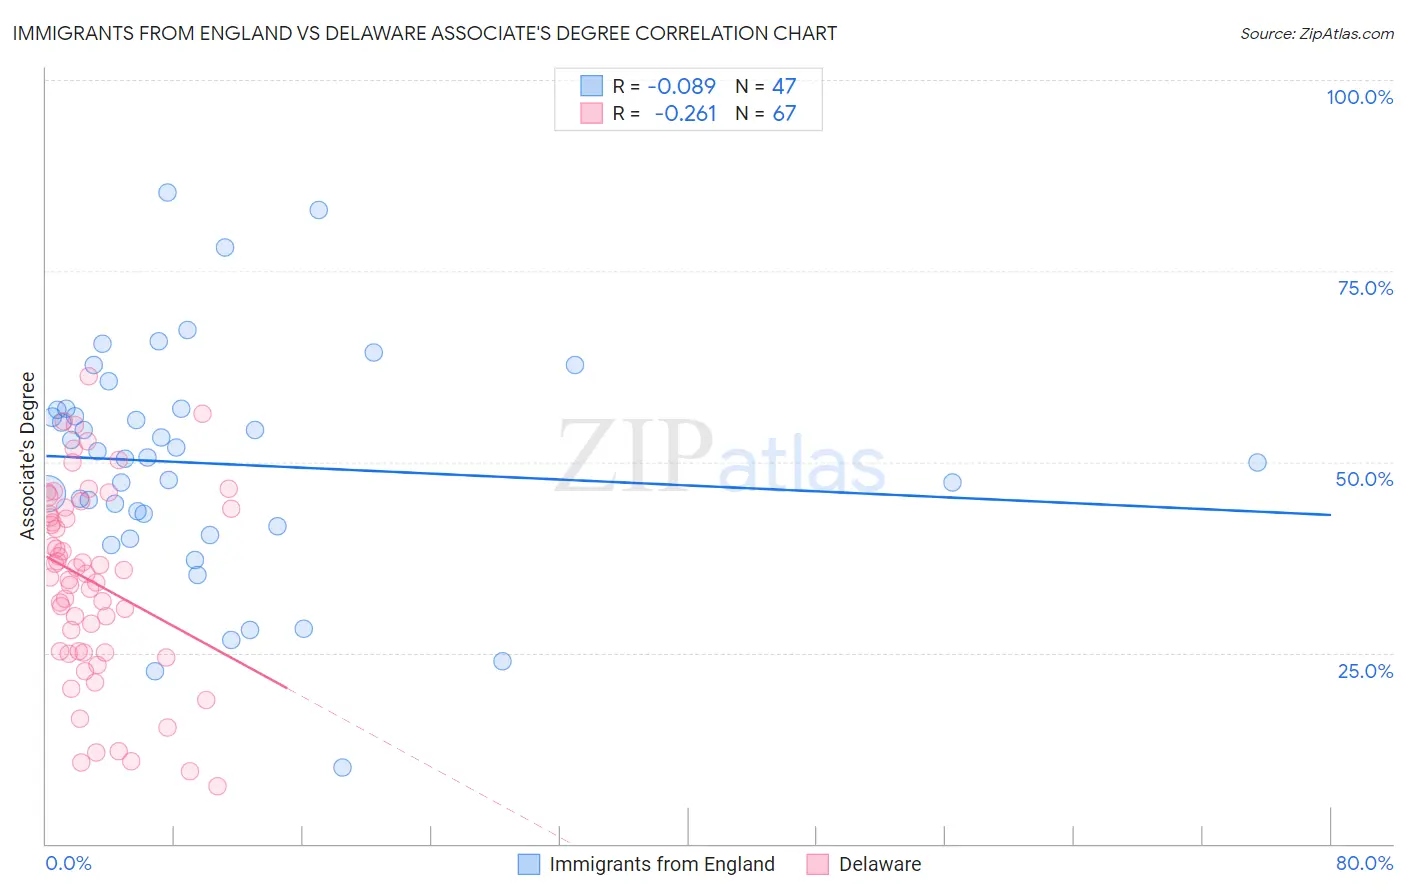
Immigrants from England vs Delaware Associate's Degree Correlation Chart
The statistical analysis conducted on geographies consisting of 391,885,412 people shows a slight negative correlation between the proportion of Immigrants from England and percentage of population with at least associate's degree education in the United States with a correlation coefficient (R) of -0.089 and weighted average of 49.7%. Similarly, the statistical analysis conducted on geographies consisting of 96,235,380 people shows a weak negative correlation between the proportion of Delaware and percentage of population with at least associate's degree education in the United States with a correlation coefficient (R) of -0.261 and weighted average of 42.3%, a difference of 17.7%.
Associate's Degree Correlation Summary
| Measurement | Immigrants from England | Delaware |
| Minimum | 10.0% | 7.5% |
| Maximum | 85.3% | 61.3% |
| Range | 75.3% | 53.7% |
| Mean | 49.8% | 34.3% |
| Median | 50.6% | 35.3% |
| Interquartile 25% (IQ1) | 41.6% | 25.0% |
| Interquartile 75% (IQ3) | 56.9% | 43.8% |
| Interquartile Range (IQR) | 15.3% | 18.8% |
| Standard Deviation (Sample) | 15.0% | 12.6% |
| Standard Deviation (Population) | 14.9% | 12.5% |
Similar Demographics by Associate's Degree
Demographics Similar to Immigrants from England by Associate's Degree
In terms of associate's degree, the demographic groups most similar to Immigrants from England are Romanian (49.7%, a difference of 0.010%), Immigrants from Ukraine (49.7%, a difference of 0.020%), Immigrants from Northern Africa (49.7%, a difference of 0.11%), Macedonian (49.6%, a difference of 0.18%), and Laotian (49.9%, a difference of 0.39%).
| Demographics | Rating | Rank | Associate's Degree |
| Immigrants | Canada | 98.7 /100 | #88 | Exceptional 50.1% |
| Immigrants | Western Europe | 98.7 /100 | #89 | Exceptional 50.1% |
| Immigrants | Ethiopia | 98.7 /100 | #90 | Exceptional 50.1% |
| Immigrants | Western Asia | 98.7 /100 | #91 | Exceptional 50.1% |
| Immigrants | North America | 98.7 /100 | #92 | Exceptional 50.1% |
| Immigrants | Brazil | 98.5 /100 | #93 | Exceptional 50.0% |
| Laotians | 98.4 /100 | #94 | Exceptional 49.9% |
| Immigrants | England | 98.0 /100 | #95 | Exceptional 49.7% |
| Romanians | 98.0 /100 | #96 | Exceptional 49.7% |
| Immigrants | Ukraine | 98.0 /100 | #97 | Exceptional 49.7% |
| Immigrants | Northern Africa | 97.9 /100 | #98 | Exceptional 49.7% |
| Macedonians | 97.8 /100 | #99 | Exceptional 49.6% |
| Immigrants | Nepal | 97.5 /100 | #100 | Exceptional 49.5% |
| Northern Europeans | 97.3 /100 | #101 | Exceptional 49.5% |
| Chileans | 97.3 /100 | #102 | Exceptional 49.4% |
Demographics Similar to Delaware by Associate's Degree
In terms of associate's degree, the demographic groups most similar to Delaware are Immigrants from Cambodia (42.3%, a difference of 0.030%), Immigrants from Liberia (42.3%, a difference of 0.050%), Immigrants from Fiji (42.2%, a difference of 0.090%), Immigrants from Ecuador (42.2%, a difference of 0.18%), and Guyanese (42.3%, a difference of 0.19%).
| Demographics | Rating | Rank | Associate's Degree |
| Immigrants | Grenada | 1.3 /100 | #239 | Tragic 42.6% |
| Cree | 1.2 /100 | #240 | Tragic 42.5% |
| British West Indians | 1.0 /100 | #241 | Tragic 42.4% |
| Immigrants | West Indies | 1.0 /100 | #242 | Tragic 42.4% |
| Guyanese | 1.0 /100 | #243 | Tragic 42.3% |
| Immigrants | Liberia | 0.9 /100 | #244 | Tragic 42.3% |
| Immigrants | Cambodia | 0.9 /100 | #245 | Tragic 42.3% |
| Delaware | 0.9 /100 | #246 | Tragic 42.3% |
| Immigrants | Fiji | 0.8 /100 | #247 | Tragic 42.2% |
| Immigrants | Ecuador | 0.8 /100 | #248 | Tragic 42.2% |
| Jamaicans | 0.7 /100 | #249 | Tragic 42.1% |
| U.S. Virgin Islanders | 0.7 /100 | #250 | Tragic 42.1% |
| Immigrants | Bahamas | 0.7 /100 | #251 | Tragic 42.1% |
| French American Indians | 0.6 /100 | #252 | Tragic 42.0% |
| Indonesians | 0.6 /100 | #253 | Tragic 41.9% |