Dominican vs Delaware Associate's Degree
COMPARE
Dominican
Delaware
Associate's Degree
Associate's Degree Comparison
Dominicans
Delaware
39.3%
ASSOCIATE'S DEGREE
0.0/ 100
METRIC RATING
291st/ 347
METRIC RANK
42.3%
ASSOCIATE'S DEGREE
0.9/ 100
METRIC RATING
246th/ 347
METRIC RANK
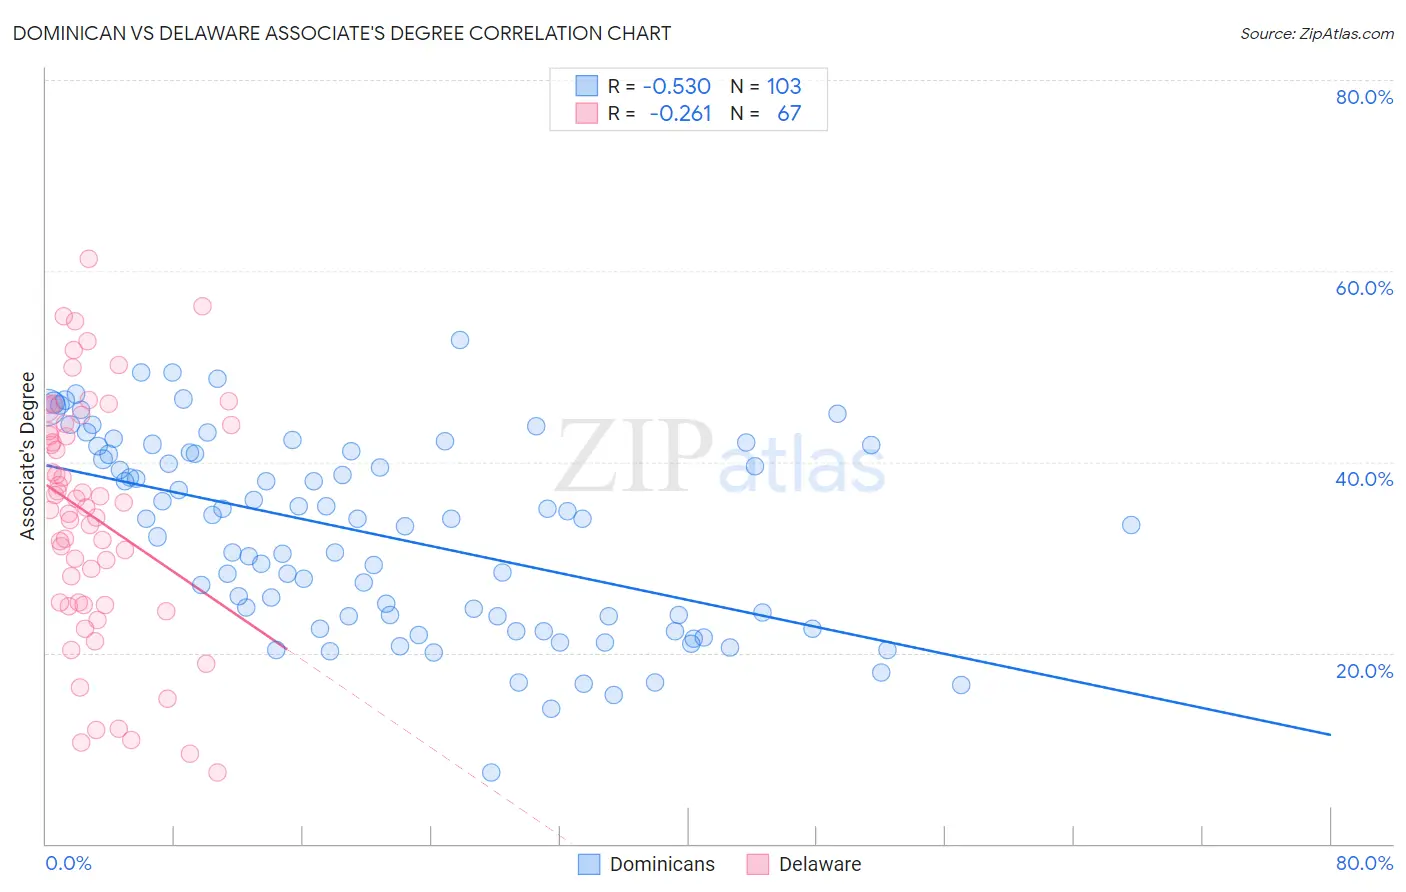
Dominican vs Delaware Associate's Degree Correlation Chart
The statistical analysis conducted on geographies consisting of 355,098,353 people shows a substantial negative correlation between the proportion of Dominicans and percentage of population with at least associate's degree education in the United States with a correlation coefficient (R) of -0.530 and weighted average of 39.3%. Similarly, the statistical analysis conducted on geographies consisting of 96,235,380 people shows a weak negative correlation between the proportion of Delaware and percentage of population with at least associate's degree education in the United States with a correlation coefficient (R) of -0.261 and weighted average of 42.3%, a difference of 7.6%.
Associate's Degree Correlation Summary
| Measurement | Dominican | Delaware |
| Minimum | 7.4% | 7.5% |
| Maximum | 52.8% | 61.3% |
| Range | 45.4% | 53.7% |
| Mean | 32.3% | 34.3% |
| Median | 34.0% | 35.3% |
| Interquartile 25% (IQ1) | 23.8% | 25.0% |
| Interquartile 75% (IQ3) | 41.0% | 43.8% |
| Interquartile Range (IQR) | 17.2% | 18.8% |
| Standard Deviation (Sample) | 10.0% | 12.6% |
| Standard Deviation (Population) | 10.0% | 12.5% |
Similar Demographics by Associate's Degree
Demographics Similar to Dominicans by Associate's Degree
In terms of associate's degree, the demographic groups most similar to Dominicans are Immigrants from Haiti (39.3%, a difference of 0.010%), Black/African American (39.1%, a difference of 0.29%), Central American (39.4%, a difference of 0.46%), Nepalese (39.0%, a difference of 0.54%), and Salvadoran (39.0%, a difference of 0.54%).
| Demographics | Rating | Rank | Associate's Degree |
| Comanche | 0.1 /100 | #284 | Tragic 39.9% |
| Immigrants | Belize | 0.1 /100 | #285 | Tragic 39.9% |
| Immigrants | Caribbean | 0.0 /100 | #286 | Tragic 39.7% |
| Aleuts | 0.0 /100 | #287 | Tragic 39.6% |
| Immigrants | Cuba | 0.0 /100 | #288 | Tragic 39.5% |
| Central Americans | 0.0 /100 | #289 | Tragic 39.4% |
| Immigrants | Haiti | 0.0 /100 | #290 | Tragic 39.3% |
| Dominicans | 0.0 /100 | #291 | Tragic 39.3% |
| Blacks/African Americans | 0.0 /100 | #292 | Tragic 39.1% |
| Nepalese | 0.0 /100 | #293 | Tragic 39.0% |
| Salvadorans | 0.0 /100 | #294 | Tragic 39.0% |
| Hondurans | 0.0 /100 | #295 | Tragic 38.9% |
| Cherokee | 0.0 /100 | #296 | Tragic 38.9% |
| Cape Verdeans | 0.0 /100 | #297 | Tragic 38.8% |
| Cheyenne | 0.0 /100 | #298 | Tragic 38.7% |
Demographics Similar to Delaware by Associate's Degree
In terms of associate's degree, the demographic groups most similar to Delaware are Immigrants from Cambodia (42.3%, a difference of 0.030%), Immigrants from Liberia (42.3%, a difference of 0.050%), Immigrants from Fiji (42.2%, a difference of 0.090%), Immigrants from Ecuador (42.2%, a difference of 0.18%), and Guyanese (42.3%, a difference of 0.19%).
| Demographics | Rating | Rank | Associate's Degree |
| Immigrants | Grenada | 1.3 /100 | #239 | Tragic 42.6% |
| Cree | 1.2 /100 | #240 | Tragic 42.5% |
| British West Indians | 1.0 /100 | #241 | Tragic 42.4% |
| Immigrants | West Indies | 1.0 /100 | #242 | Tragic 42.4% |
| Guyanese | 1.0 /100 | #243 | Tragic 42.3% |
| Immigrants | Liberia | 0.9 /100 | #244 | Tragic 42.3% |
| Immigrants | Cambodia | 0.9 /100 | #245 | Tragic 42.3% |
| Delaware | 0.9 /100 | #246 | Tragic 42.3% |
| Immigrants | Fiji | 0.8 /100 | #247 | Tragic 42.2% |
| Immigrants | Ecuador | 0.8 /100 | #248 | Tragic 42.2% |
| Jamaicans | 0.7 /100 | #249 | Tragic 42.1% |
| U.S. Virgin Islanders | 0.7 /100 | #250 | Tragic 42.1% |
| Immigrants | Bahamas | 0.7 /100 | #251 | Tragic 42.1% |
| French American Indians | 0.6 /100 | #252 | Tragic 42.0% |
| Indonesians | 0.6 /100 | #253 | Tragic 41.9% |