Mongolian vs Delaware Associate's Degree
COMPARE
Mongolian
Delaware
Associate's Degree
Associate's Degree Comparison
Mongolians
Delaware
53.0%
ASSOCIATE'S DEGREE
100.0/ 100
METRIC RATING
38th/ 347
METRIC RANK
42.3%
ASSOCIATE'S DEGREE
0.9/ 100
METRIC RATING
246th/ 347
METRIC RANK
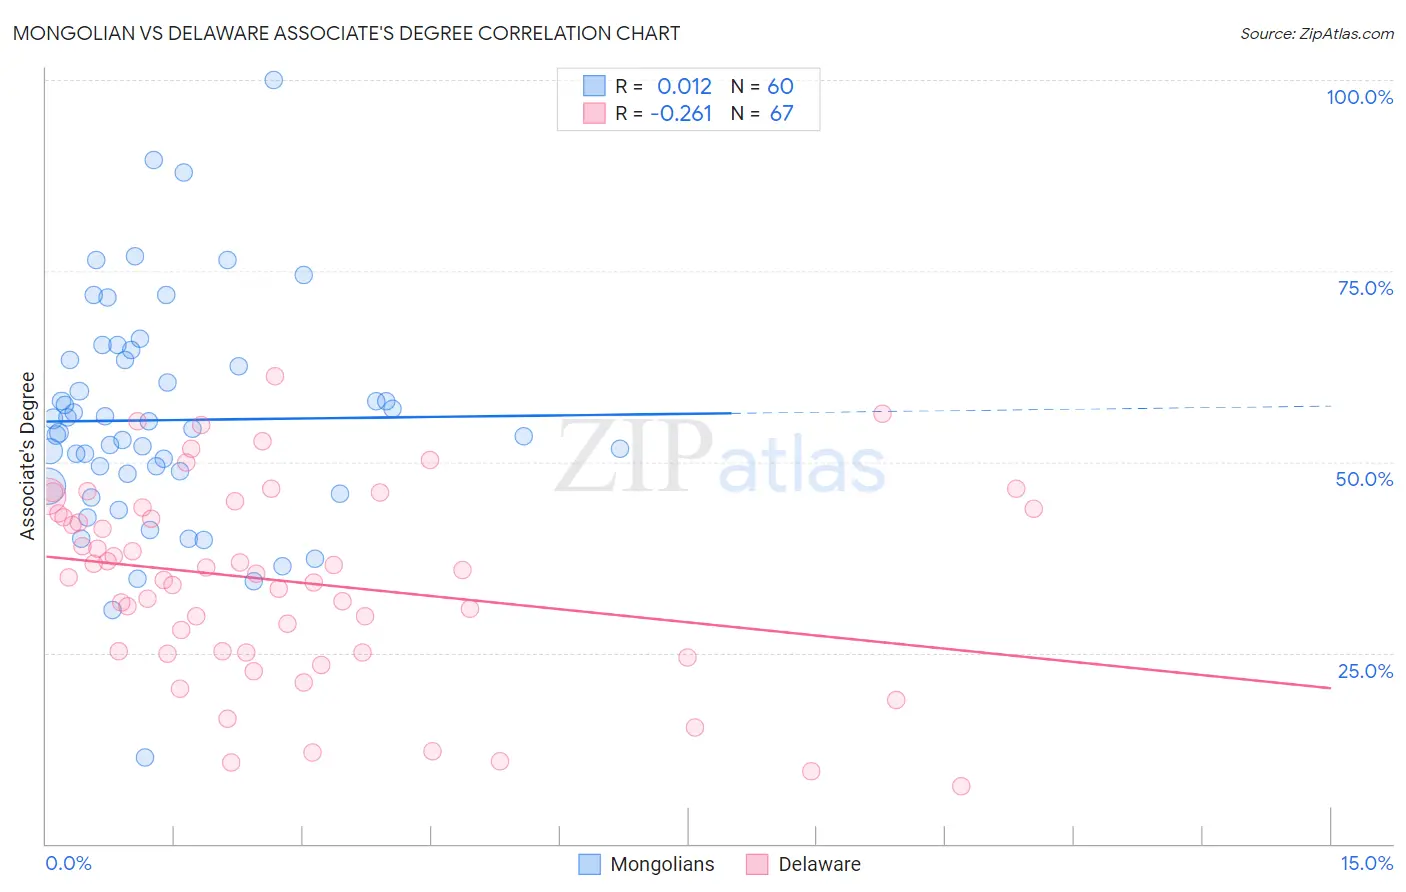
Mongolian vs Delaware Associate's Degree Correlation Chart
The statistical analysis conducted on geographies consisting of 140,359,763 people shows no correlation between the proportion of Mongolians and percentage of population with at least associate's degree education in the United States with a correlation coefficient (R) of 0.012 and weighted average of 53.0%. Similarly, the statistical analysis conducted on geographies consisting of 96,235,380 people shows a weak negative correlation between the proportion of Delaware and percentage of population with at least associate's degree education in the United States with a correlation coefficient (R) of -0.261 and weighted average of 42.3%, a difference of 25.4%.
Associate's Degree Correlation Summary
| Measurement | Mongolian | Delaware |
| Minimum | 11.2% | 7.5% |
| Maximum | 100.0% | 61.3% |
| Range | 88.8% | 53.7% |
| Mean | 55.5% | 34.3% |
| Median | 54.1% | 35.3% |
| Interquartile 25% (IQ1) | 47.6% | 25.0% |
| Interquartile 75% (IQ3) | 63.3% | 43.8% |
| Interquartile Range (IQR) | 15.7% | 18.8% |
| Standard Deviation (Sample) | 15.0% | 12.6% |
| Standard Deviation (Population) | 14.9% | 12.5% |
Similar Demographics by Associate's Degree
Demographics Similar to Mongolians by Associate's Degree
In terms of associate's degree, the demographic groups most similar to Mongolians are Immigrants from Denmark (53.1%, a difference of 0.16%), Immigrants from Russia (53.1%, a difference of 0.25%), Immigrants from Belarus (52.8%, a difference of 0.29%), Immigrants from Latvia (52.8%, a difference of 0.36%), and Russian (53.2%, a difference of 0.53%).
| Demographics | Rating | Rank | Associate's Degree |
| Immigrants | Northern Europe | 100.0 /100 | #31 | Exceptional 53.5% |
| Immigrants | Turkey | 100.0 /100 | #32 | Exceptional 53.4% |
| Israelis | 100.0 /100 | #33 | Exceptional 53.4% |
| Bulgarians | 100.0 /100 | #34 | Exceptional 53.3% |
| Russians | 100.0 /100 | #35 | Exceptional 53.2% |
| Immigrants | Russia | 100.0 /100 | #36 | Exceptional 53.1% |
| Immigrants | Denmark | 100.0 /100 | #37 | Exceptional 53.1% |
| Mongolians | 100.0 /100 | #38 | Exceptional 53.0% |
| Immigrants | Belarus | 99.9 /100 | #39 | Exceptional 52.8% |
| Immigrants | Latvia | 99.9 /100 | #40 | Exceptional 52.8% |
| Immigrants | Saudi Arabia | 99.9 /100 | #41 | Exceptional 52.6% |
| Immigrants | Malaysia | 99.9 /100 | #42 | Exceptional 52.5% |
| Immigrants | South Africa | 99.9 /100 | #43 | Exceptional 52.5% |
| Estonians | 99.9 /100 | #44 | Exceptional 52.5% |
| Immigrants | Lithuania | 99.9 /100 | #45 | Exceptional 52.4% |
Demographics Similar to Delaware by Associate's Degree
In terms of associate's degree, the demographic groups most similar to Delaware are Immigrants from Cambodia (42.3%, a difference of 0.030%), Immigrants from Liberia (42.3%, a difference of 0.050%), Immigrants from Fiji (42.2%, a difference of 0.090%), Immigrants from Ecuador (42.2%, a difference of 0.18%), and Guyanese (42.3%, a difference of 0.19%).
| Demographics | Rating | Rank | Associate's Degree |
| Immigrants | Grenada | 1.3 /100 | #239 | Tragic 42.6% |
| Cree | 1.2 /100 | #240 | Tragic 42.5% |
| British West Indians | 1.0 /100 | #241 | Tragic 42.4% |
| Immigrants | West Indies | 1.0 /100 | #242 | Tragic 42.4% |
| Guyanese | 1.0 /100 | #243 | Tragic 42.3% |
| Immigrants | Liberia | 0.9 /100 | #244 | Tragic 42.3% |
| Immigrants | Cambodia | 0.9 /100 | #245 | Tragic 42.3% |
| Delaware | 0.9 /100 | #246 | Tragic 42.3% |
| Immigrants | Fiji | 0.8 /100 | #247 | Tragic 42.2% |
| Immigrants | Ecuador | 0.8 /100 | #248 | Tragic 42.2% |
| Jamaicans | 0.7 /100 | #249 | Tragic 42.1% |
| U.S. Virgin Islanders | 0.7 /100 | #250 | Tragic 42.1% |
| Immigrants | Bahamas | 0.7 /100 | #251 | Tragic 42.1% |
| French American Indians | 0.6 /100 | #252 | Tragic 42.0% |
| Indonesians | 0.6 /100 | #253 | Tragic 41.9% |