Immigrants from Sierra Leone vs Delaware Associate's Degree
COMPARE
Immigrants from Sierra Leone
Delaware
Associate's Degree
Associate's Degree Comparison
Immigrants from Sierra Leone
Delaware
46.7%
ASSOCIATE'S DEGREE
59.2/ 100
METRIC RATING
167th/ 347
METRIC RANK
42.3%
ASSOCIATE'S DEGREE
0.9/ 100
METRIC RATING
246th/ 347
METRIC RANK
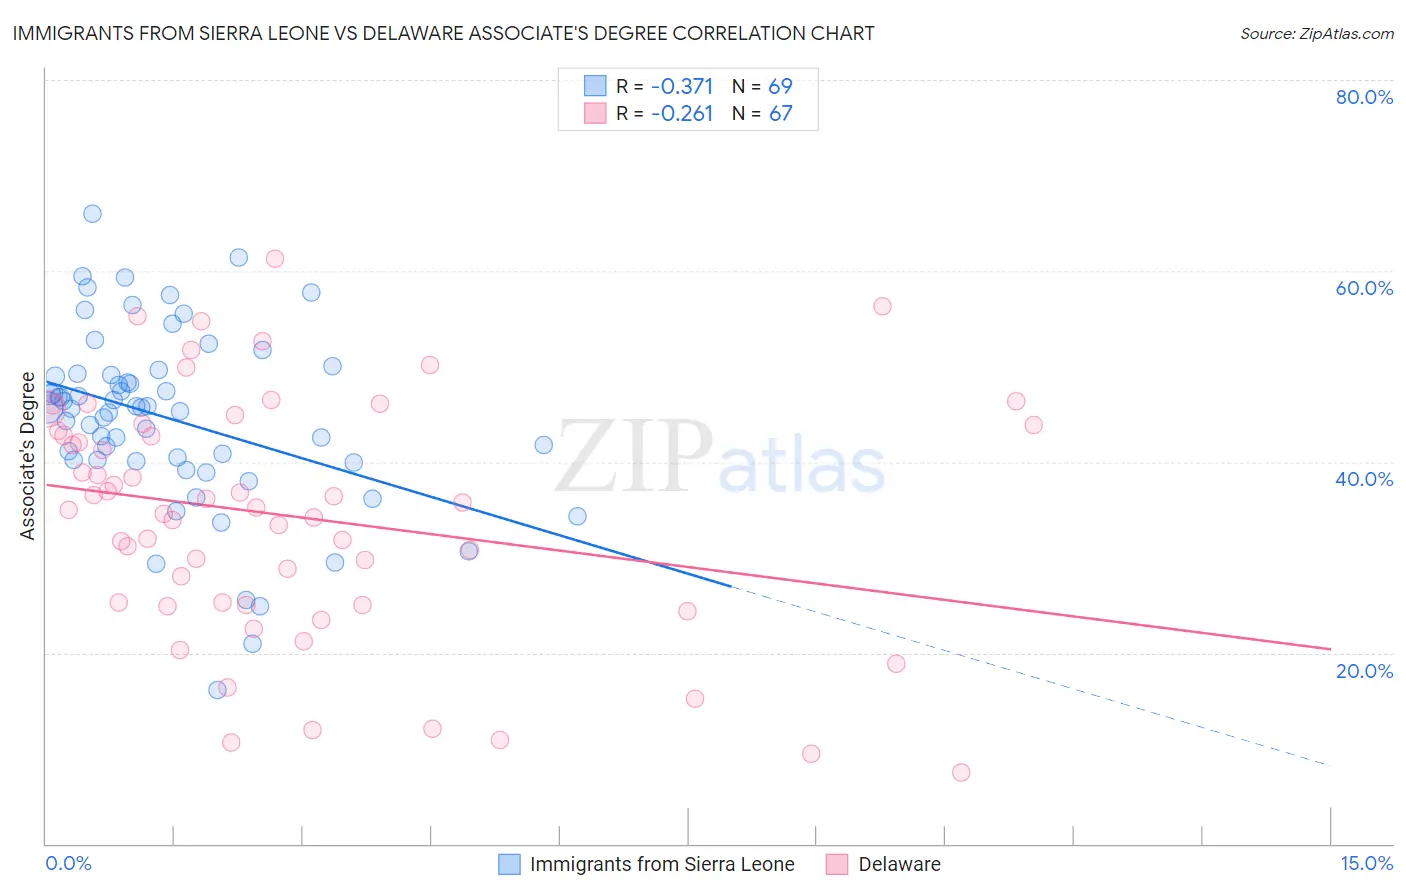
Immigrants from Sierra Leone vs Delaware Associate's Degree Correlation Chart
The statistical analysis conducted on geographies consisting of 101,624,736 people shows a mild negative correlation between the proportion of Immigrants from Sierra Leone and percentage of population with at least associate's degree education in the United States with a correlation coefficient (R) of -0.371 and weighted average of 46.7%. Similarly, the statistical analysis conducted on geographies consisting of 96,235,380 people shows a weak negative correlation between the proportion of Delaware and percentage of population with at least associate's degree education in the United States with a correlation coefficient (R) of -0.261 and weighted average of 42.3%, a difference of 10.5%.
Associate's Degree Correlation Summary
| Measurement | Immigrants from Sierra Leone | Delaware |
| Minimum | 16.1% | 7.5% |
| Maximum | 66.0% | 61.3% |
| Range | 50.0% | 53.7% |
| Mean | 44.5% | 34.3% |
| Median | 45.7% | 35.3% |
| Interquartile 25% (IQ1) | 40.1% | 25.0% |
| Interquartile 75% (IQ3) | 49.2% | 43.8% |
| Interquartile Range (IQR) | 9.1% | 18.8% |
| Standard Deviation (Sample) | 9.5% | 12.6% |
| Standard Deviation (Population) | 9.4% | 12.5% |
Similar Demographics by Associate's Degree
Demographics Similar to Immigrants from Sierra Leone by Associate's Degree
In terms of associate's degree, the demographic groups most similar to Immigrants from Sierra Leone are Hungarian (46.7%, a difference of 0.010%), Immigrants from South America (46.7%, a difference of 0.050%), Colombian (46.8%, a difference of 0.25%), Somali (46.8%, a difference of 0.26%), and Immigrants from Somalia (46.5%, a difference of 0.29%).
| Demographics | Rating | Rank | Associate's Degree |
| Scottish | 65.4 /100 | #160 | Good 46.9% |
| Scandinavians | 65.2 /100 | #161 | Good 46.9% |
| Immigrants | Africa | 63.2 /100 | #162 | Good 46.8% |
| Somalis | 62.5 /100 | #163 | Good 46.8% |
| Colombians | 62.4 /100 | #164 | Good 46.8% |
| Immigrants | South America | 59.9 /100 | #165 | Average 46.7% |
| Hungarians | 59.3 /100 | #166 | Average 46.7% |
| Immigrants | Sierra Leone | 59.2 /100 | #167 | Average 46.7% |
| Immigrants | Somalia | 55.5 /100 | #168 | Average 46.5% |
| Uruguayans | 55.4 /100 | #169 | Average 46.5% |
| Irish | 53.6 /100 | #170 | Average 46.5% |
| Basques | 52.8 /100 | #171 | Average 46.5% |
| Peruvians | 50.5 /100 | #172 | Average 46.4% |
| Immigrants | Iraq | 50.3 /100 | #173 | Average 46.4% |
| English | 50.0 /100 | #174 | Average 46.4% |
Demographics Similar to Delaware by Associate's Degree
In terms of associate's degree, the demographic groups most similar to Delaware are Immigrants from Cambodia (42.3%, a difference of 0.030%), Immigrants from Liberia (42.3%, a difference of 0.050%), Immigrants from Fiji (42.2%, a difference of 0.090%), Immigrants from Ecuador (42.2%, a difference of 0.18%), and Guyanese (42.3%, a difference of 0.19%).
| Demographics | Rating | Rank | Associate's Degree |
| Immigrants | Grenada | 1.3 /100 | #239 | Tragic 42.6% |
| Cree | 1.2 /100 | #240 | Tragic 42.5% |
| British West Indians | 1.0 /100 | #241 | Tragic 42.4% |
| Immigrants | West Indies | 1.0 /100 | #242 | Tragic 42.4% |
| Guyanese | 1.0 /100 | #243 | Tragic 42.3% |
| Immigrants | Liberia | 0.9 /100 | #244 | Tragic 42.3% |
| Immigrants | Cambodia | 0.9 /100 | #245 | Tragic 42.3% |
| Delaware | 0.9 /100 | #246 | Tragic 42.3% |
| Immigrants | Fiji | 0.8 /100 | #247 | Tragic 42.2% |
| Immigrants | Ecuador | 0.8 /100 | #248 | Tragic 42.2% |
| Jamaicans | 0.7 /100 | #249 | Tragic 42.1% |
| U.S. Virgin Islanders | 0.7 /100 | #250 | Tragic 42.1% |
| Immigrants | Bahamas | 0.7 /100 | #251 | Tragic 42.1% |
| French American Indians | 0.6 /100 | #252 | Tragic 42.0% |
| Indonesians | 0.6 /100 | #253 | Tragic 41.9% |