Immigrants from North Macedonia vs Delaware Associate's Degree
COMPARE
Immigrants from North Macedonia
Delaware
Associate's Degree
Associate's Degree Comparison
Immigrants from North Macedonia
Delaware
47.4%
ASSOCIATE'S DEGREE
76.0/ 100
METRIC RATING
151st/ 347
METRIC RANK
42.3%
ASSOCIATE'S DEGREE
0.9/ 100
METRIC RATING
246th/ 347
METRIC RANK
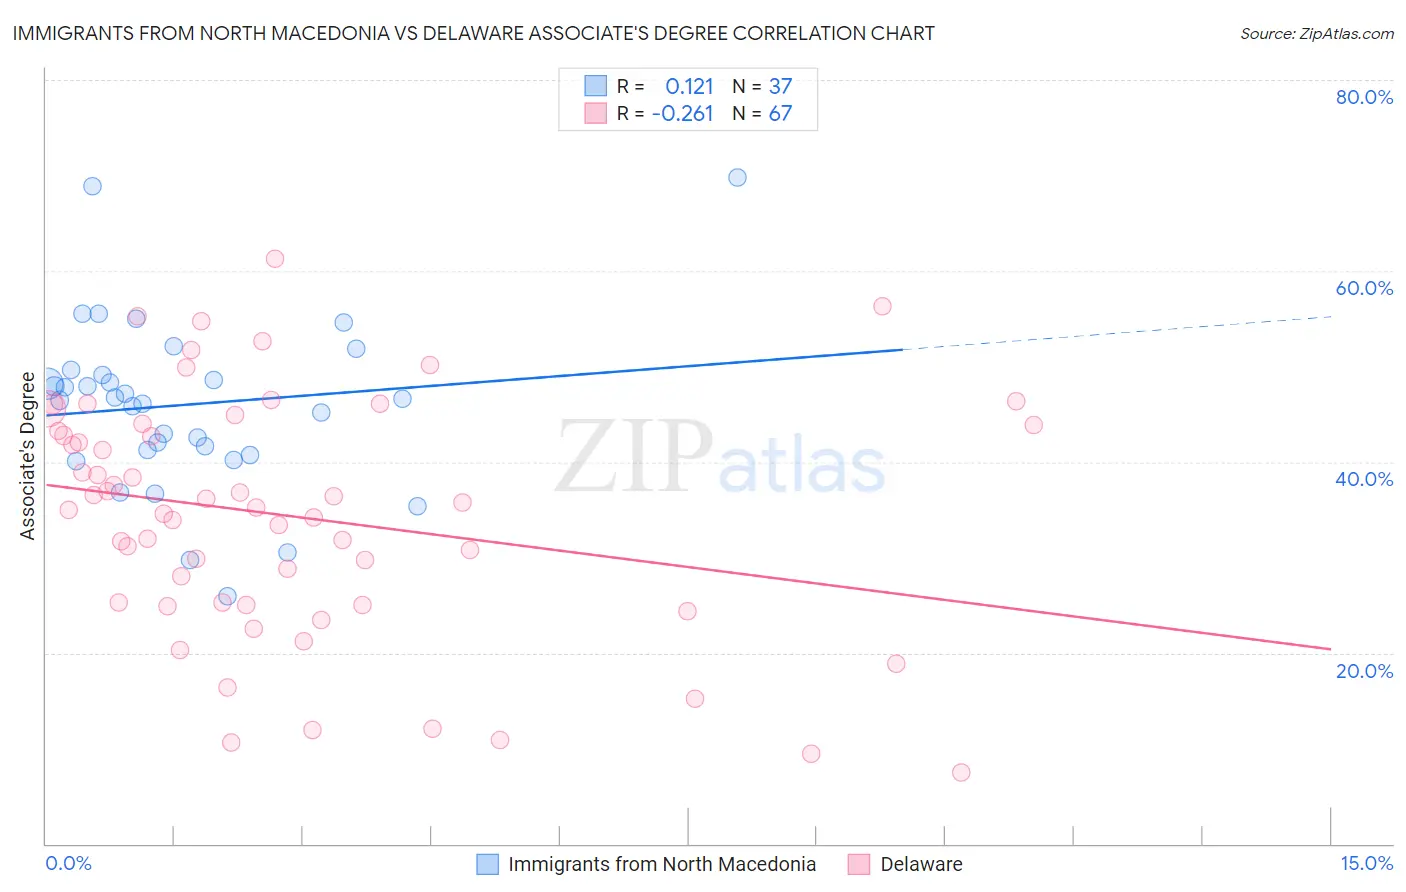
Immigrants from North Macedonia vs Delaware Associate's Degree Correlation Chart
The statistical analysis conducted on geographies consisting of 74,317,045 people shows a poor positive correlation between the proportion of Immigrants from North Macedonia and percentage of population with at least associate's degree education in the United States with a correlation coefficient (R) of 0.121 and weighted average of 47.4%. Similarly, the statistical analysis conducted on geographies consisting of 96,235,380 people shows a weak negative correlation between the proportion of Delaware and percentage of population with at least associate's degree education in the United States with a correlation coefficient (R) of -0.261 and weighted average of 42.3%, a difference of 12.1%.
Associate's Degree Correlation Summary
| Measurement | Immigrants from North Macedonia | Delaware |
| Minimum | 25.9% | 7.5% |
| Maximum | 69.8% | 61.3% |
| Range | 43.9% | 53.7% |
| Mean | 46.0% | 34.3% |
| Median | 46.6% | 35.3% |
| Interquartile 25% (IQ1) | 41.0% | 25.0% |
| Interquartile 75% (IQ3) | 49.3% | 43.8% |
| Interquartile Range (IQR) | 8.3% | 18.8% |
| Standard Deviation (Sample) | 9.0% | 12.6% |
| Standard Deviation (Population) | 8.9% | 12.5% |
Similar Demographics by Associate's Degree
Demographics Similar to Immigrants from North Macedonia by Associate's Degree
In terms of associate's degree, the demographic groups most similar to Immigrants from North Macedonia are Iraqi (47.4%, a difference of 0.020%), Immigrants from Armenia (47.4%, a difference of 0.060%), South American Indian (47.4%, a difference of 0.070%), Danish (47.4%, a difference of 0.14%), and Immigrants from Afghanistan (47.3%, a difference of 0.17%).
| Demographics | Rating | Rank | Associate's Degree |
| Slavs | 80.5 /100 | #144 | Excellent 47.6% |
| Canadians | 79.0 /100 | #145 | Good 47.5% |
| Immigrants | Sudan | 77.9 /100 | #146 | Good 47.4% |
| Danes | 77.3 /100 | #147 | Good 47.4% |
| South American Indians | 76.7 /100 | #148 | Good 47.4% |
| Immigrants | Armenia | 76.6 /100 | #149 | Good 47.4% |
| Iraqis | 76.2 /100 | #150 | Good 47.4% |
| Immigrants | North Macedonia | 76.0 /100 | #151 | Good 47.4% |
| Immigrants | Afghanistan | 74.3 /100 | #152 | Good 47.3% |
| Czechs | 72.2 /100 | #153 | Good 47.2% |
| Immigrants | Kenya | 72.1 /100 | #154 | Good 47.2% |
| Kenyans | 70.6 /100 | #155 | Good 47.1% |
| South Americans | 70.5 /100 | #156 | Good 47.1% |
| Sudanese | 70.3 /100 | #157 | Good 47.1% |
| Immigrants | Germany | 69.7 /100 | #158 | Good 47.1% |
Demographics Similar to Delaware by Associate's Degree
In terms of associate's degree, the demographic groups most similar to Delaware are Immigrants from Cambodia (42.3%, a difference of 0.030%), Immigrants from Liberia (42.3%, a difference of 0.050%), Immigrants from Fiji (42.2%, a difference of 0.090%), Immigrants from Ecuador (42.2%, a difference of 0.18%), and Guyanese (42.3%, a difference of 0.19%).
| Demographics | Rating | Rank | Associate's Degree |
| Immigrants | Grenada | 1.3 /100 | #239 | Tragic 42.6% |
| Cree | 1.2 /100 | #240 | Tragic 42.5% |
| British West Indians | 1.0 /100 | #241 | Tragic 42.4% |
| Immigrants | West Indies | 1.0 /100 | #242 | Tragic 42.4% |
| Guyanese | 1.0 /100 | #243 | Tragic 42.3% |
| Immigrants | Liberia | 0.9 /100 | #244 | Tragic 42.3% |
| Immigrants | Cambodia | 0.9 /100 | #245 | Tragic 42.3% |
| Delaware | 0.9 /100 | #246 | Tragic 42.3% |
| Immigrants | Fiji | 0.8 /100 | #247 | Tragic 42.2% |
| Immigrants | Ecuador | 0.8 /100 | #248 | Tragic 42.2% |
| Jamaicans | 0.7 /100 | #249 | Tragic 42.1% |
| U.S. Virgin Islanders | 0.7 /100 | #250 | Tragic 42.1% |
| Immigrants | Bahamas | 0.7 /100 | #251 | Tragic 42.1% |
| French American Indians | 0.6 /100 | #252 | Tragic 42.0% |
| Indonesians | 0.6 /100 | #253 | Tragic 41.9% |