Puget Sound Salish vs Spanish American GED/Equivalency
COMPARE
Puget Sound Salish
Spanish American
GED/Equivalency
GED/Equivalency Comparison
Puget Sound Salish
Spanish Americans
85.2%
GED/EQUIVALENCY
20.8/ 100
METRIC RATING
194th/ 347
METRIC RANK
83.6%
GED/EQUIVALENCY
0.8/ 100
METRIC RATING
251st/ 347
METRIC RANK
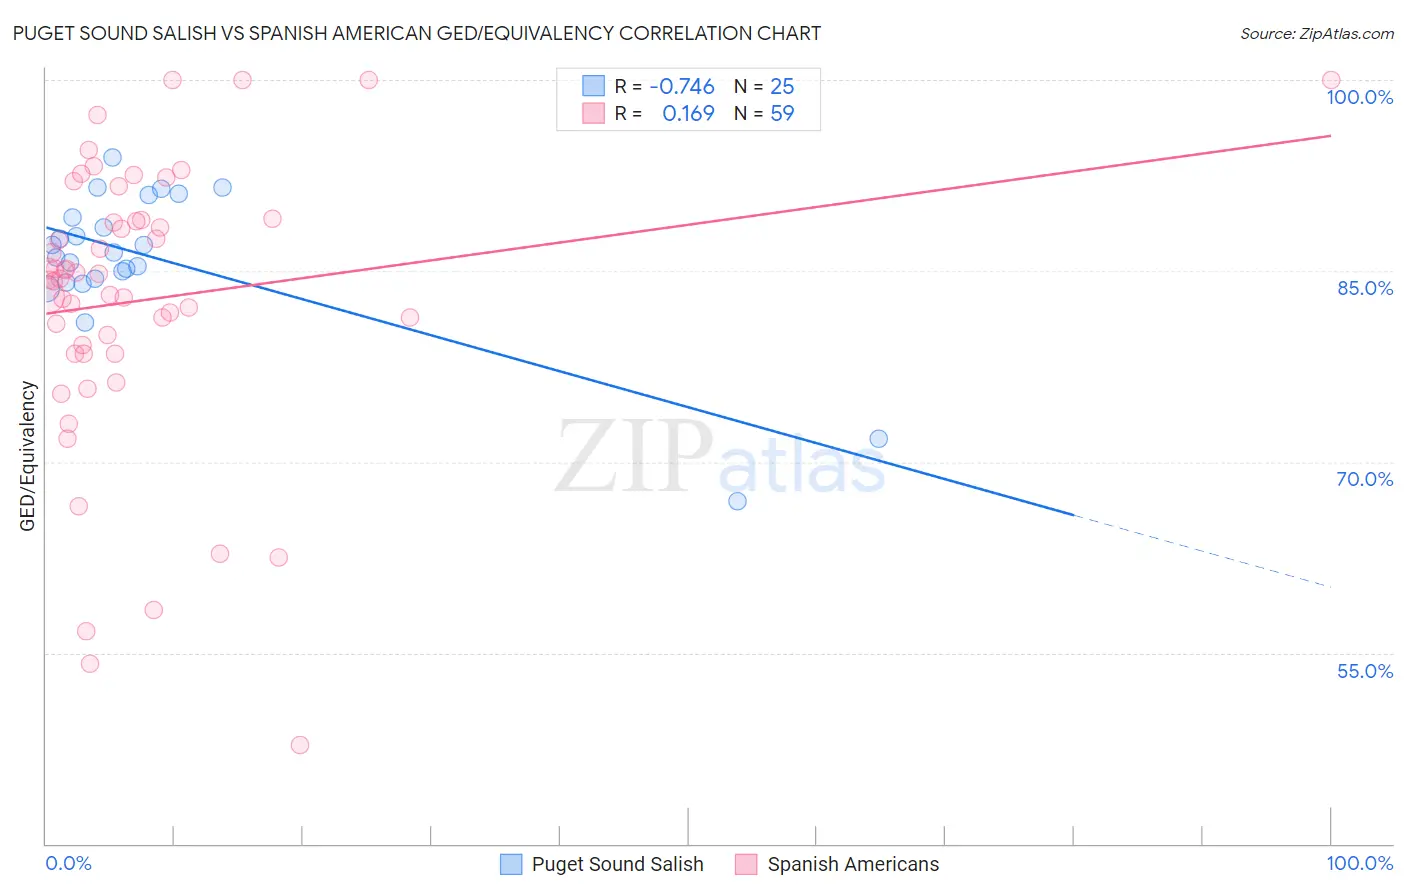
Puget Sound Salish vs Spanish American GED/Equivalency Correlation Chart
The statistical analysis conducted on geographies consisting of 46,155,775 people shows a strong negative correlation between the proportion of Puget Sound Salish and percentage of population with at least ged/equivalency education in the United States with a correlation coefficient (R) of -0.746 and weighted average of 85.2%. Similarly, the statistical analysis conducted on geographies consisting of 103,168,542 people shows a poor positive correlation between the proportion of Spanish Americans and percentage of population with at least ged/equivalency education in the United States with a correlation coefficient (R) of 0.169 and weighted average of 83.6%, a difference of 1.8%.
GED/Equivalency Correlation Summary
| Measurement | Puget Sound Salish | Spanish American |
| Minimum | 66.9% | 47.7% |
| Maximum | 93.9% | 100.0% |
| Range | 26.9% | 52.3% |
| Mean | 85.9% | 82.7% |
| Median | 86.5% | 84.3% |
| Interquartile 25% (IQ1) | 84.3% | 78.5% |
| Interquartile 75% (IQ3) | 90.1% | 89.0% |
| Interquartile Range (IQR) | 5.8% | 10.5% |
| Standard Deviation (Sample) | 5.9% | 11.3% |
| Standard Deviation (Population) | 5.8% | 11.2% |
Similar Demographics by GED/Equivalency
Demographics Similar to Puget Sound Salish by GED/Equivalency
In terms of ged/equivalency, the demographic groups most similar to Puget Sound Salish are Chippewa (85.2%, a difference of 0.0%), Tongan (85.2%, a difference of 0.0%), Costa Rican (85.2%, a difference of 0.010%), Delaware (85.2%, a difference of 0.040%), and South American Indian (85.2%, a difference of 0.060%).
| Demographics | Rating | Rank | GED/Equivalency |
| Immigrants | Afghanistan | 29.8 /100 | #187 | Fair 85.4% |
| Immigrants | Sierra Leone | 29.0 /100 | #188 | Fair 85.4% |
| Guamanians/Chamorros | 28.4 /100 | #189 | Fair 85.3% |
| Alaskan Athabascans | 27.5 /100 | #190 | Fair 85.3% |
| South American Indians | 22.8 /100 | #191 | Fair 85.2% |
| Immigrants | Nonimmigrants | 22.7 /100 | #192 | Fair 85.2% |
| Delaware | 22.2 /100 | #193 | Fair 85.2% |
| Puget Sound Salish | 20.8 /100 | #194 | Fair 85.2% |
| Chippewa | 20.8 /100 | #195 | Fair 85.2% |
| Tongans | 20.7 /100 | #196 | Fair 85.2% |
| Costa Ricans | 20.4 /100 | #197 | Fair 85.2% |
| Immigrants | Africa | 17.5 /100 | #198 | Poor 85.1% |
| Somalis | 16.4 /100 | #199 | Poor 85.0% |
| Uruguayans | 16.0 /100 | #200 | Poor 85.0% |
| Portuguese | 15.9 /100 | #201 | Poor 85.0% |
Demographics Similar to Spanish Americans by GED/Equivalency
In terms of ged/equivalency, the demographic groups most similar to Spanish Americans are Bahamian (83.6%, a difference of 0.0%), Comanche (83.6%, a difference of 0.060%), Creek (83.6%, a difference of 0.090%), Shoshone (83.7%, a difference of 0.15%), and Crow (83.8%, a difference of 0.16%).
| Demographics | Rating | Rank | GED/Equivalency |
| Immigrants | Ghana | 1.3 /100 | #244 | Tragic 83.9% |
| Immigrants | Senegal | 1.2 /100 | #245 | Tragic 83.8% |
| Chickasaw | 1.2 /100 | #246 | Tragic 83.8% |
| Immigrants | Western Africa | 1.1 /100 | #247 | Tragic 83.8% |
| Blackfeet | 1.1 /100 | #248 | Tragic 83.8% |
| Crow | 1.1 /100 | #249 | Tragic 83.8% |
| Shoshone | 1.0 /100 | #250 | Tragic 83.7% |
| Spanish Americans | 0.8 /100 | #251 | Tragic 83.6% |
| Bahamians | 0.8 /100 | #252 | Tragic 83.6% |
| Comanche | 0.7 /100 | #253 | Tragic 83.6% |
| Creek | 0.7 /100 | #254 | Tragic 83.6% |
| Colville | 0.5 /100 | #255 | Tragic 83.4% |
| Africans | 0.5 /100 | #256 | Tragic 83.4% |
| Jamaicans | 0.4 /100 | #257 | Tragic 83.3% |
| Malaysians | 0.4 /100 | #258 | Tragic 83.3% |