Puget Sound Salish vs Canadian GED/Equivalency
COMPARE
Puget Sound Salish
Canadian
GED/Equivalency
GED/Equivalency Comparison
Puget Sound Salish
Canadians
85.2%
GED/EQUIVALENCY
20.8/ 100
METRIC RATING
194th/ 347
METRIC RANK
87.1%
GED/EQUIVALENCY
95.6/ 100
METRIC RATING
108th/ 347
METRIC RANK
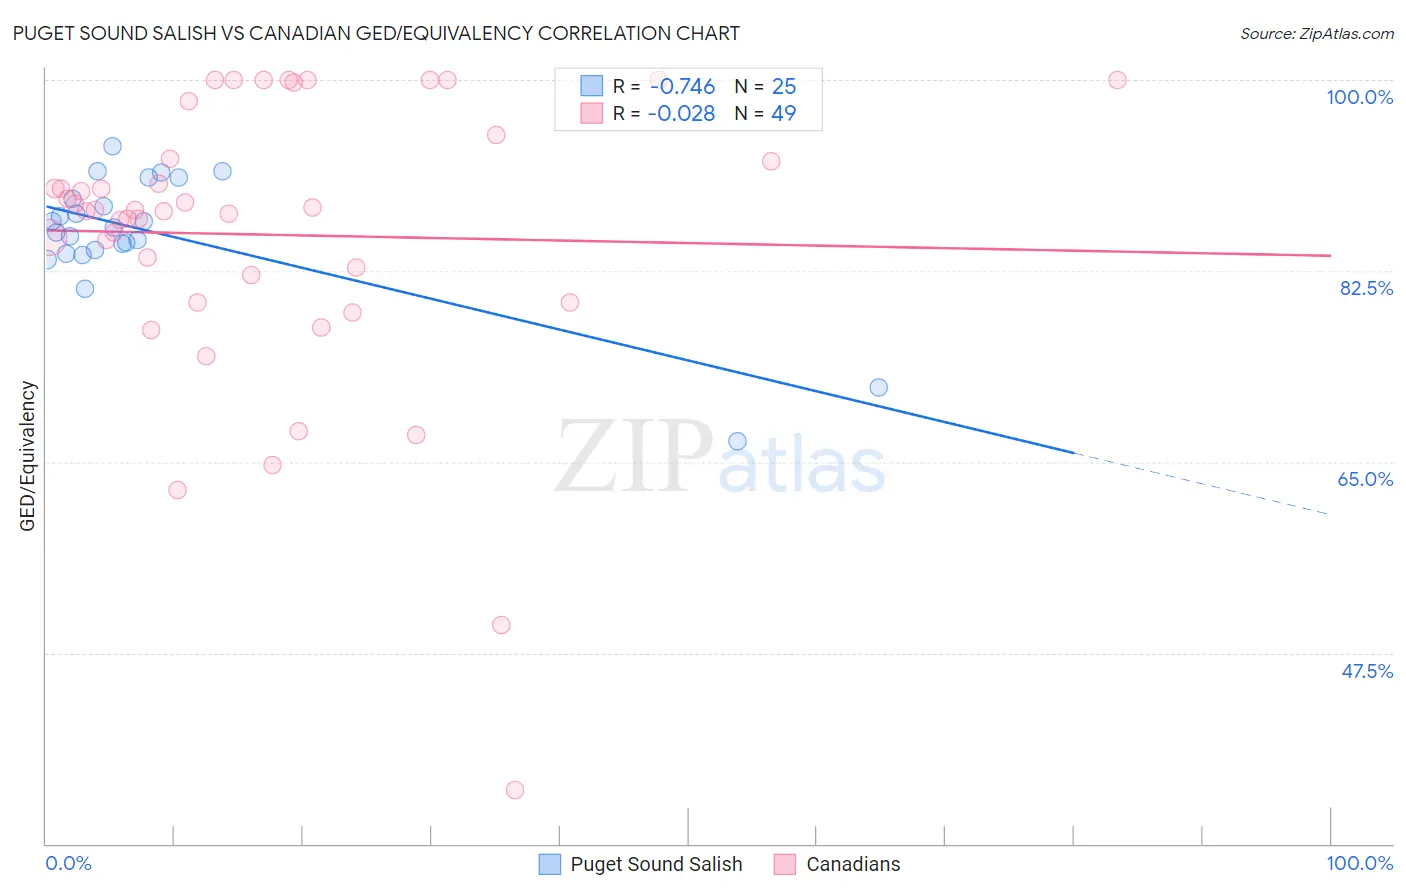
Puget Sound Salish vs Canadian GED/Equivalency Correlation Chart
The statistical analysis conducted on geographies consisting of 46,155,775 people shows a strong negative correlation between the proportion of Puget Sound Salish and percentage of population with at least ged/equivalency education in the United States with a correlation coefficient (R) of -0.746 and weighted average of 85.2%. Similarly, the statistical analysis conducted on geographies consisting of 437,556,595 people shows no correlation between the proportion of Canadians and percentage of population with at least ged/equivalency education in the United States with a correlation coefficient (R) of -0.028 and weighted average of 87.1%, a difference of 2.3%.
GED/Equivalency Correlation Summary
| Measurement | Puget Sound Salish | Canadian |
| Minimum | 66.9% | 34.9% |
| Maximum | 93.9% | 100.0% |
| Range | 26.9% | 65.1% |
| Mean | 85.9% | 85.8% |
| Median | 86.5% | 88.1% |
| Interquartile 25% (IQ1) | 84.3% | 80.9% |
| Interquartile 75% (IQ3) | 90.1% | 93.9% |
| Interquartile Range (IQR) | 5.8% | 13.0% |
| Standard Deviation (Sample) | 5.9% | 13.3% |
| Standard Deviation (Population) | 5.8% | 13.1% |
Similar Demographics by GED/Equivalency
Demographics Similar to Puget Sound Salish by GED/Equivalency
In terms of ged/equivalency, the demographic groups most similar to Puget Sound Salish are Chippewa (85.2%, a difference of 0.0%), Tongan (85.2%, a difference of 0.0%), Costa Rican (85.2%, a difference of 0.010%), Delaware (85.2%, a difference of 0.040%), and South American Indian (85.2%, a difference of 0.060%).
| Demographics | Rating | Rank | GED/Equivalency |
| Immigrants | Afghanistan | 29.8 /100 | #187 | Fair 85.4% |
| Immigrants | Sierra Leone | 29.0 /100 | #188 | Fair 85.4% |
| Guamanians/Chamorros | 28.4 /100 | #189 | Fair 85.3% |
| Alaskan Athabascans | 27.5 /100 | #190 | Fair 85.3% |
| South American Indians | 22.8 /100 | #191 | Fair 85.2% |
| Immigrants | Nonimmigrants | 22.7 /100 | #192 | Fair 85.2% |
| Delaware | 22.2 /100 | #193 | Fair 85.2% |
| Puget Sound Salish | 20.8 /100 | #194 | Fair 85.2% |
| Chippewa | 20.8 /100 | #195 | Fair 85.2% |
| Tongans | 20.7 /100 | #196 | Fair 85.2% |
| Costa Ricans | 20.4 /100 | #197 | Fair 85.2% |
| Immigrants | Africa | 17.5 /100 | #198 | Poor 85.1% |
| Somalis | 16.4 /100 | #199 | Poor 85.0% |
| Uruguayans | 16.0 /100 | #200 | Poor 85.0% |
| Portuguese | 15.9 /100 | #201 | Poor 85.0% |
Demographics Similar to Canadians by GED/Equivalency
In terms of ged/equivalency, the demographic groups most similar to Canadians are Immigrants from Eastern Europe (87.1%, a difference of 0.010%), Icelander (87.1%, a difference of 0.020%), Immigrants from Zimbabwe (87.1%, a difference of 0.030%), Indian (Asian) (87.1%, a difference of 0.040%), and Egyptian (87.1%, a difference of 0.040%).
| Demographics | Rating | Rank | GED/Equivalency |
| Syrians | 96.6 /100 | #101 | Exceptional 87.2% |
| Lebanese | 96.2 /100 | #102 | Exceptional 87.2% |
| Jordanians | 96.1 /100 | #103 | Exceptional 87.2% |
| Immigrants | Hungary | 96.0 /100 | #104 | Exceptional 87.2% |
| Indians (Asian) | 95.9 /100 | #105 | Exceptional 87.1% |
| Immigrants | Zimbabwe | 95.8 /100 | #106 | Exceptional 87.1% |
| Icelanders | 95.7 /100 | #107 | Exceptional 87.1% |
| Canadians | 95.6 /100 | #108 | Exceptional 87.1% |
| Immigrants | Eastern Europe | 95.5 /100 | #109 | Exceptional 87.1% |
| Egyptians | 95.3 /100 | #110 | Exceptional 87.1% |
| French | 95.2 /100 | #111 | Exceptional 87.1% |
| Tlingit-Haida | 94.8 /100 | #112 | Exceptional 87.0% |
| Assyrians/Chaldeans/Syriacs | 94.8 /100 | #113 | Exceptional 87.0% |
| Immigrants | Kazakhstan | 94.7 /100 | #114 | Exceptional 87.0% |
| Mongolians | 94.6 /100 | #115 | Exceptional 87.0% |