Puget Sound Salish vs Ghanaian Unemployment Among Seniors over 75 years
COMPARE
Puget Sound Salish
Ghanaian
Unemployment Among Seniors over 75 years
Unemployment Among Seniors over 75 years Comparison
Puget Sound Salish
Ghanaians
10.0%
UNEMPLOYMENT AMONG SENIORS OVER 75 YEARS
0.0/ 100
METRIC RATING
303rd/ 347
METRIC RANK
8.4%
UNEMPLOYMENT AMONG SENIORS OVER 75 YEARS
96.0/ 100
METRIC RATING
129th/ 347
METRIC RANK
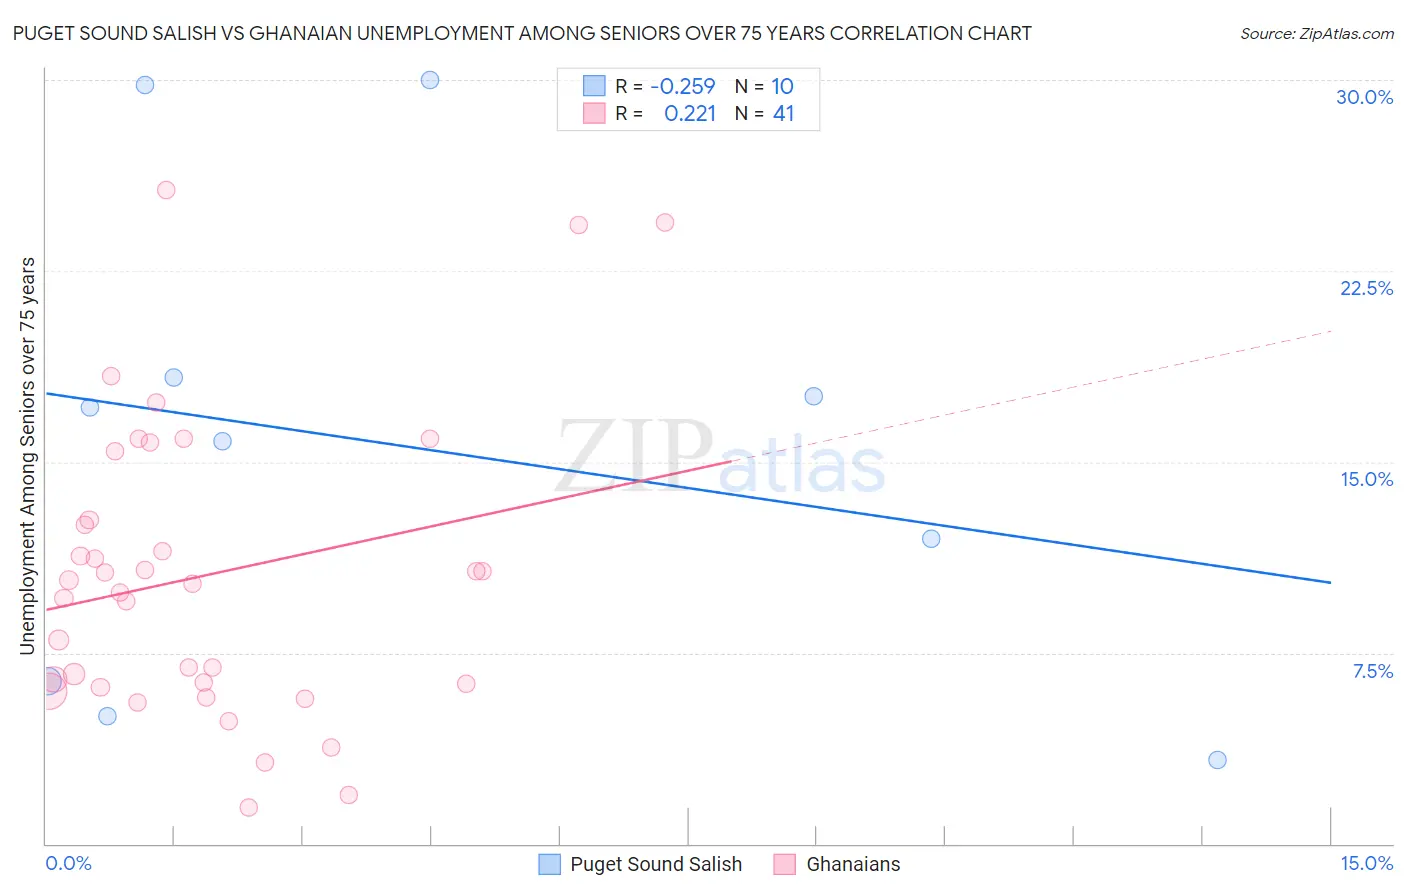
Puget Sound Salish vs Ghanaian Unemployment Among Seniors over 75 years Correlation Chart
The statistical analysis conducted on geographies consisting of 33,735,975 people shows a weak negative correlation between the proportion of Puget Sound Salish and unemployment rate among seniors over the age of 75 in the United States with a correlation coefficient (R) of -0.259 and weighted average of 10.0%. Similarly, the statistical analysis conducted on geographies consisting of 121,858,478 people shows a weak positive correlation between the proportion of Ghanaians and unemployment rate among seniors over the age of 75 in the United States with a correlation coefficient (R) of 0.221 and weighted average of 8.4%, a difference of 19.1%.
Unemployment Among Seniors over 75 years Correlation Summary
| Measurement | Puget Sound Salish | Ghanaian |
| Minimum | 3.3% | 1.4% |
| Maximum | 30.0% | 25.7% |
| Range | 26.7% | 24.3% |
| Mean | 15.5% | 10.5% |
| Median | 16.5% | 10.2% |
| Interquartile 25% (IQ1) | 6.4% | 6.2% |
| Interquartile 75% (IQ3) | 18.3% | 14.1% |
| Interquartile Range (IQR) | 11.9% | 7.9% |
| Standard Deviation (Sample) | 9.3% | 5.9% |
| Standard Deviation (Population) | 8.9% | 5.8% |
Similar Demographics by Unemployment Among Seniors over 75 years
Demographics Similar to Puget Sound Salish by Unemployment Among Seniors over 75 years
In terms of unemployment among seniors over 75 years, the demographic groups most similar to Puget Sound Salish are Scotch-Irish (10.0%, a difference of 0.010%), Finnish (10.0%, a difference of 0.070%), Welsh (10.0%, a difference of 0.18%), Swedish (10.0%, a difference of 0.20%), and Italian (10.0%, a difference of 0.35%).
| Demographics | Rating | Rank | Unemployment Among Seniors over 75 years |
| Immigrants | St. Vincent and the Grenadines | 0.0 /100 | #296 | Tragic 9.8% |
| Cherokee | 0.0 /100 | #297 | Tragic 9.8% |
| Lithuanians | 0.0 /100 | #298 | Tragic 9.9% |
| Belgians | 0.0 /100 | #299 | Tragic 9.9% |
| Iraqis | 0.0 /100 | #300 | Tragic 9.9% |
| Welsh | 0.0 /100 | #301 | Tragic 10.0% |
| Finns | 0.0 /100 | #302 | Tragic 10.0% |
| Puget Sound Salish | 0.0 /100 | #303 | Tragic 10.0% |
| Scotch-Irish | 0.0 /100 | #304 | Tragic 10.0% |
| Swedes | 0.0 /100 | #305 | Tragic 10.0% |
| Italians | 0.0 /100 | #306 | Tragic 10.0% |
| Immigrants | Fiji | 0.0 /100 | #307 | Tragic 10.0% |
| Whites/Caucasians | 0.0 /100 | #308 | Tragic 10.1% |
| English | 0.0 /100 | #309 | Tragic 10.1% |
| Hungarians | 0.0 /100 | #310 | Tragic 10.1% |
Demographics Similar to Ghanaians by Unemployment Among Seniors over 75 years
In terms of unemployment among seniors over 75 years, the demographic groups most similar to Ghanaians are Native Hawaiian (8.4%, a difference of 0.030%), Honduran (8.4%, a difference of 0.080%), Belizean (8.4%, a difference of 0.090%), Apache (8.4%, a difference of 0.28%), and Immigrants from Moldova (8.3%, a difference of 0.29%).
| Demographics | Rating | Rank | Unemployment Among Seniors over 75 years |
| Immigrants | Russia | 97.1 /100 | #122 | Exceptional 8.3% |
| Immigrants | Nepal | 96.9 /100 | #123 | Exceptional 8.3% |
| Thais | 96.8 /100 | #124 | Exceptional 8.3% |
| Immigrants | Moldova | 96.7 /100 | #125 | Exceptional 8.3% |
| Belizeans | 96.3 /100 | #126 | Exceptional 8.4% |
| Hondurans | 96.2 /100 | #127 | Exceptional 8.4% |
| Native Hawaiians | 96.1 /100 | #128 | Exceptional 8.4% |
| Ghanaians | 96.0 /100 | #129 | Exceptional 8.4% |
| Apache | 95.2 /100 | #130 | Exceptional 8.4% |
| German Russians | 94.9 /100 | #131 | Exceptional 8.4% |
| Chileans | 93.8 /100 | #132 | Exceptional 8.4% |
| Serbians | 93.7 /100 | #133 | Exceptional 8.4% |
| Immigrants | Czechoslovakia | 93.4 /100 | #134 | Exceptional 8.4% |
| Haitians | 91.4 /100 | #135 | Exceptional 8.5% |
| Immigrants | Trinidad and Tobago | 90.8 /100 | #136 | Exceptional 8.5% |