Potawatomi vs Mongolian GED/Equivalency
COMPARE
Potawatomi
Mongolian
GED/Equivalency
GED/Equivalency Comparison
Potawatomi
Mongolians
84.7%
GED/EQUIVALENCY
8.2/ 100
METRIC RATING
219th/ 347
METRIC RANK
87.0%
GED/EQUIVALENCY
94.6/ 100
METRIC RATING
115th/ 347
METRIC RANK
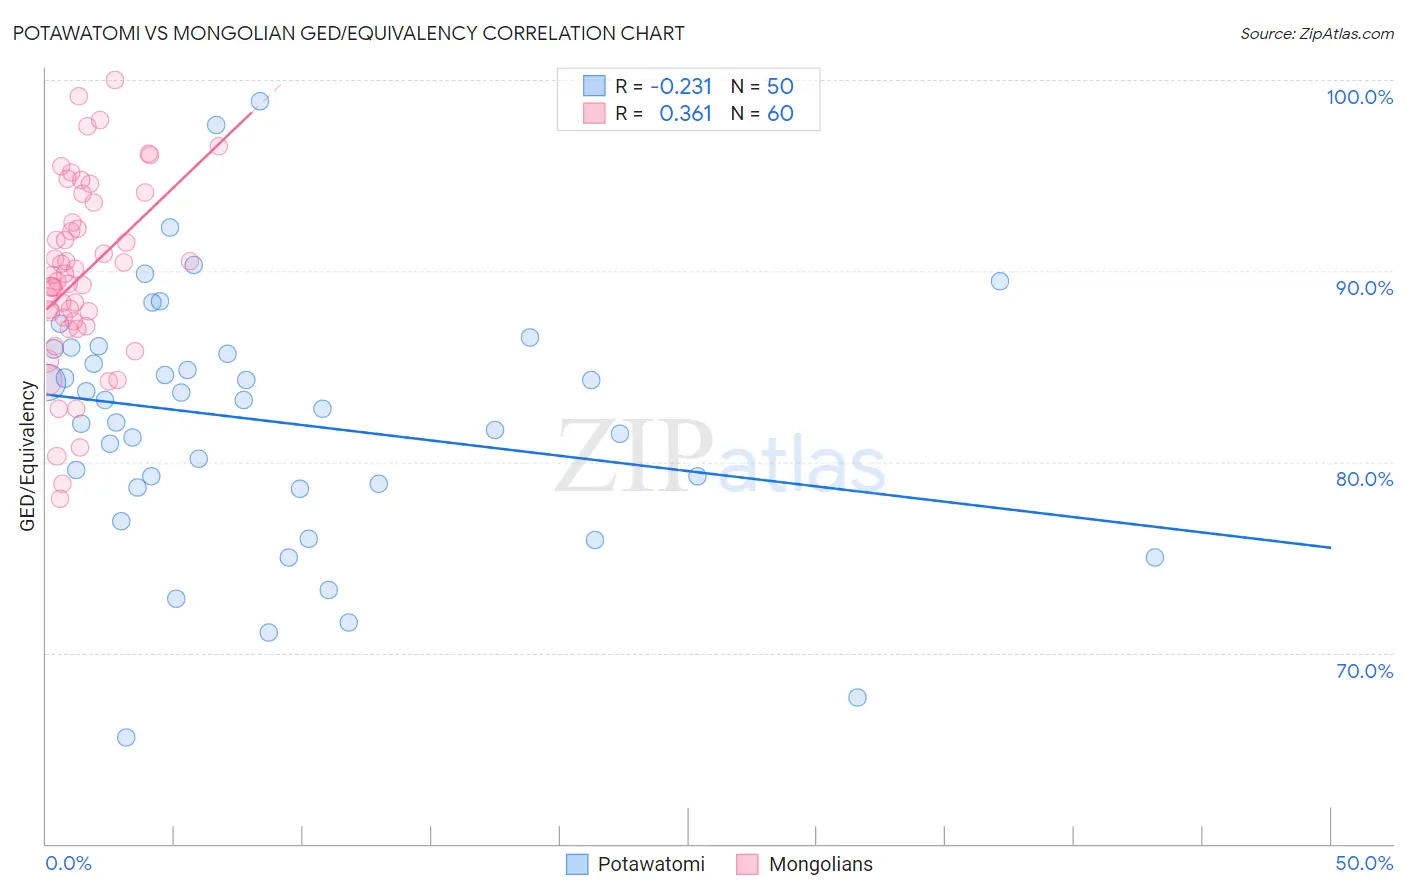
Potawatomi vs Mongolian GED/Equivalency Correlation Chart
The statistical analysis conducted on geographies consisting of 117,774,097 people shows a weak negative correlation between the proportion of Potawatomi and percentage of population with at least ged/equivalency education in the United States with a correlation coefficient (R) of -0.231 and weighted average of 84.7%. Similarly, the statistical analysis conducted on geographies consisting of 140,361,663 people shows a mild positive correlation between the proportion of Mongolians and percentage of population with at least ged/equivalency education in the United States with a correlation coefficient (R) of 0.361 and weighted average of 87.0%, a difference of 2.8%.
GED/Equivalency Correlation Summary
| Measurement | Potawatomi | Mongolian |
| Minimum | 65.6% | 78.1% |
| Maximum | 98.9% | 100.0% |
| Range | 33.3% | 21.9% |
| Mean | 82.1% | 89.8% |
| Median | 83.0% | 89.6% |
| Interquartile 25% (IQ1) | 78.6% | 87.2% |
| Interquartile 75% (IQ3) | 85.9% | 93.1% |
| Interquartile Range (IQR) | 7.3% | 5.8% |
| Standard Deviation (Sample) | 6.7% | 4.8% |
| Standard Deviation (Population) | 6.6% | 4.8% |
Similar Demographics by GED/Equivalency
Demographics Similar to Potawatomi by GED/Equivalency
In terms of ged/equivalency, the demographic groups most similar to Potawatomi are American (84.7%, a difference of 0.0%), Taiwanese (84.7%, a difference of 0.010%), Immigrants from Micronesia (84.7%, a difference of 0.030%), Nigerian (84.7%, a difference of 0.030%), and Alaska Native (84.7%, a difference of 0.030%).
| Demographics | Rating | Rank | GED/Equivalency |
| Immigrants | Somalia | 10.6 /100 | #212 | Poor 84.8% |
| Immigrants | Philippines | 10.0 /100 | #213 | Poor 84.8% |
| Osage | 9.5 /100 | #214 | Tragic 84.8% |
| Peruvians | 9.2 /100 | #215 | Tragic 84.7% |
| Immigrants | Micronesia | 8.7 /100 | #216 | Tragic 84.7% |
| Nigerians | 8.6 /100 | #217 | Tragic 84.7% |
| Alaska Natives | 8.6 /100 | #218 | Tragic 84.7% |
| Potawatomi | 8.2 /100 | #219 | Tragic 84.7% |
| Americans | 8.2 /100 | #220 | Tragic 84.7% |
| Taiwanese | 8.1 /100 | #221 | Tragic 84.7% |
| Iroquois | 7.5 /100 | #222 | Tragic 84.6% |
| Immigrants | Uzbekistan | 7.1 /100 | #223 | Tragic 84.6% |
| French American Indians | 6.3 /100 | #224 | Tragic 84.6% |
| Immigrants | Thailand | 5.8 /100 | #225 | Tragic 84.5% |
| Immigrants | Zaire | 5.5 /100 | #226 | Tragic 84.5% |
Demographics Similar to Mongolians by GED/Equivalency
In terms of ged/equivalency, the demographic groups most similar to Mongolians are Immigrants from Kazakhstan (87.0%, a difference of 0.010%), Swiss (87.0%, a difference of 0.010%), Tlingit-Haida (87.0%, a difference of 0.020%), Assyrian/Chaldean/Syriac (87.0%, a difference of 0.020%), and French (87.1%, a difference of 0.060%).
| Demographics | Rating | Rank | GED/Equivalency |
| Canadians | 95.6 /100 | #108 | Exceptional 87.1% |
| Immigrants | Eastern Europe | 95.5 /100 | #109 | Exceptional 87.1% |
| Egyptians | 95.3 /100 | #110 | Exceptional 87.1% |
| French | 95.2 /100 | #111 | Exceptional 87.1% |
| Tlingit-Haida | 94.8 /100 | #112 | Exceptional 87.0% |
| Assyrians/Chaldeans/Syriacs | 94.8 /100 | #113 | Exceptional 87.0% |
| Immigrants | Kazakhstan | 94.7 /100 | #114 | Exceptional 87.0% |
| Mongolians | 94.6 /100 | #115 | Exceptional 87.0% |
| Swiss | 94.5 /100 | #116 | Exceptional 87.0% |
| Immigrants | Hong Kong | 93.8 /100 | #117 | Exceptional 86.9% |
| French Canadians | 93.2 /100 | #118 | Exceptional 86.9% |
| Immigrants | China | 93.2 /100 | #119 | Exceptional 86.9% |
| Scotch-Irish | 91.6 /100 | #120 | Exceptional 86.8% |
| Immigrants | Lebanon | 90.9 /100 | #121 | Exceptional 86.8% |
| Immigrants | Jordan | 90.8 /100 | #122 | Exceptional 86.8% |