Shoshone vs Mongolian GED/Equivalency
COMPARE
Shoshone
Mongolian
GED/Equivalency
GED/Equivalency Comparison
Shoshone
Mongolians
83.7%
GED/EQUIVALENCY
1.0/ 100
METRIC RATING
250th/ 347
METRIC RANK
87.0%
GED/EQUIVALENCY
94.6/ 100
METRIC RATING
115th/ 347
METRIC RANK
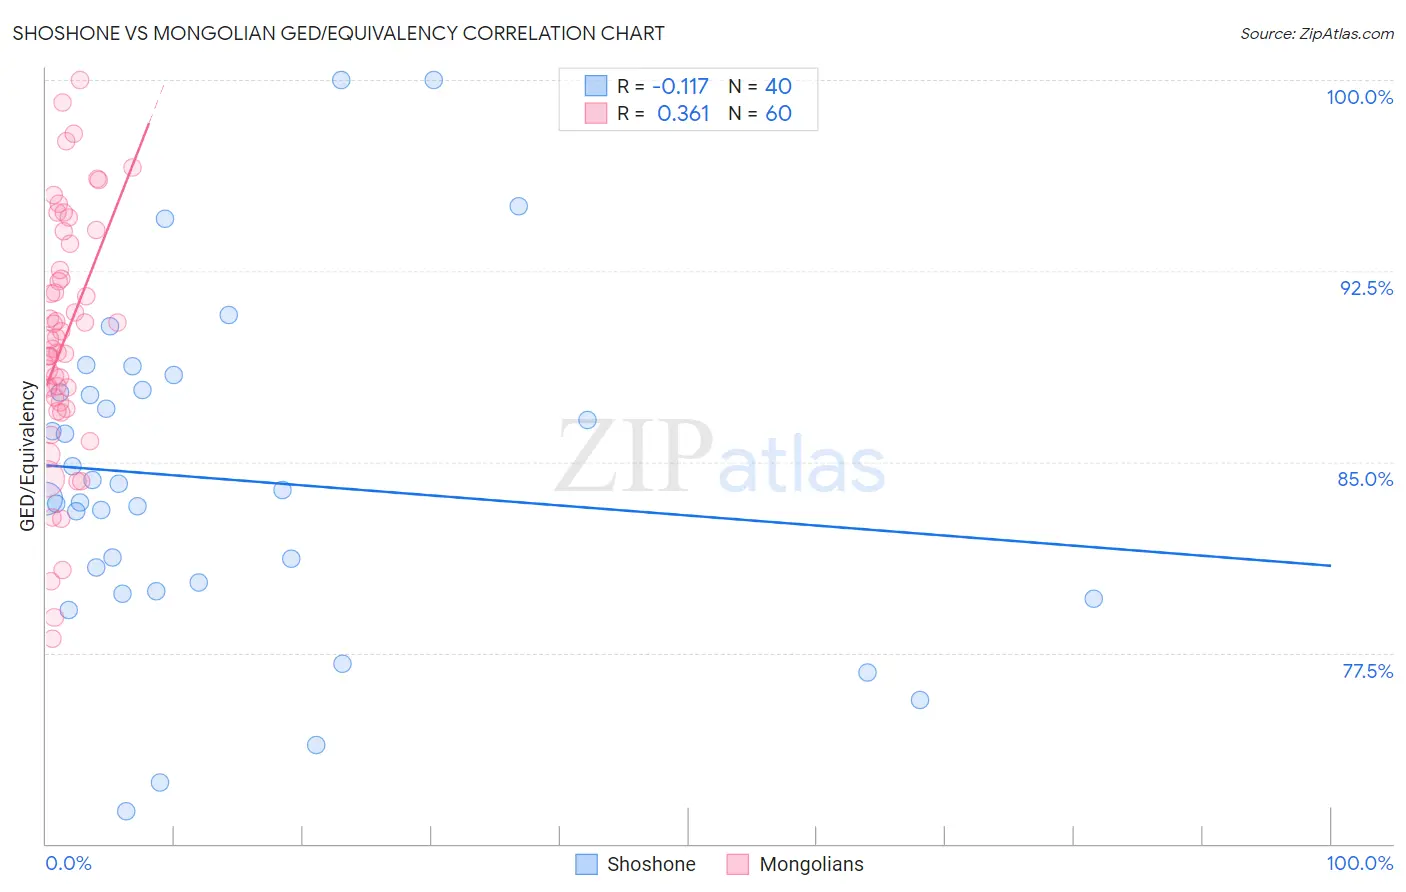
Shoshone vs Mongolian GED/Equivalency Correlation Chart
The statistical analysis conducted on geographies consisting of 66,627,351 people shows a poor negative correlation between the proportion of Shoshone and percentage of population with at least ged/equivalency education in the United States with a correlation coefficient (R) of -0.117 and weighted average of 83.7%. Similarly, the statistical analysis conducted on geographies consisting of 140,361,663 people shows a mild positive correlation between the proportion of Mongolians and percentage of population with at least ged/equivalency education in the United States with a correlation coefficient (R) of 0.361 and weighted average of 87.0%, a difference of 3.9%.
GED/Equivalency Correlation Summary
| Measurement | Shoshone | Mongolian |
| Minimum | 71.3% | 78.1% |
| Maximum | 100.0% | 100.0% |
| Range | 28.7% | 21.9% |
| Mean | 84.3% | 89.8% |
| Median | 83.7% | 89.6% |
| Interquartile 25% (IQ1) | 80.1% | 87.2% |
| Interquartile 75% (IQ3) | 87.8% | 93.1% |
| Interquartile Range (IQR) | 7.7% | 5.8% |
| Standard Deviation (Sample) | 6.5% | 4.8% |
| Standard Deviation (Population) | 6.4% | 4.8% |
Similar Demographics by GED/Equivalency
Demographics Similar to Shoshone by GED/Equivalency
In terms of ged/equivalency, the demographic groups most similar to Shoshone are Blackfeet (83.8%, a difference of 0.020%), Crow (83.8%, a difference of 0.020%), Immigrants from Western Africa (83.8%, a difference of 0.040%), Chickasaw (83.8%, a difference of 0.070%), and Immigrants from Senegal (83.8%, a difference of 0.090%).
| Demographics | Rating | Rank | GED/Equivalency |
| Cherokee | 1.3 /100 | #243 | Tragic 83.9% |
| Immigrants | Ghana | 1.3 /100 | #244 | Tragic 83.9% |
| Immigrants | Senegal | 1.2 /100 | #245 | Tragic 83.8% |
| Chickasaw | 1.2 /100 | #246 | Tragic 83.8% |
| Immigrants | Western Africa | 1.1 /100 | #247 | Tragic 83.8% |
| Blackfeet | 1.1 /100 | #248 | Tragic 83.8% |
| Crow | 1.1 /100 | #249 | Tragic 83.8% |
| Shoshone | 1.0 /100 | #250 | Tragic 83.7% |
| Spanish Americans | 0.8 /100 | #251 | Tragic 83.6% |
| Bahamians | 0.8 /100 | #252 | Tragic 83.6% |
| Comanche | 0.7 /100 | #253 | Tragic 83.6% |
| Creek | 0.7 /100 | #254 | Tragic 83.6% |
| Colville | 0.5 /100 | #255 | Tragic 83.4% |
| Africans | 0.5 /100 | #256 | Tragic 83.4% |
| Jamaicans | 0.4 /100 | #257 | Tragic 83.3% |
Demographics Similar to Mongolians by GED/Equivalency
In terms of ged/equivalency, the demographic groups most similar to Mongolians are Immigrants from Kazakhstan (87.0%, a difference of 0.010%), Swiss (87.0%, a difference of 0.010%), Tlingit-Haida (87.0%, a difference of 0.020%), Assyrian/Chaldean/Syriac (87.0%, a difference of 0.020%), and French (87.1%, a difference of 0.060%).
| Demographics | Rating | Rank | GED/Equivalency |
| Canadians | 95.6 /100 | #108 | Exceptional 87.1% |
| Immigrants | Eastern Europe | 95.5 /100 | #109 | Exceptional 87.1% |
| Egyptians | 95.3 /100 | #110 | Exceptional 87.1% |
| French | 95.2 /100 | #111 | Exceptional 87.1% |
| Tlingit-Haida | 94.8 /100 | #112 | Exceptional 87.0% |
| Assyrians/Chaldeans/Syriacs | 94.8 /100 | #113 | Exceptional 87.0% |
| Immigrants | Kazakhstan | 94.7 /100 | #114 | Exceptional 87.0% |
| Mongolians | 94.6 /100 | #115 | Exceptional 87.0% |
| Swiss | 94.5 /100 | #116 | Exceptional 87.0% |
| Immigrants | Hong Kong | 93.8 /100 | #117 | Exceptional 86.9% |
| French Canadians | 93.2 /100 | #118 | Exceptional 86.9% |
| Immigrants | China | 93.2 /100 | #119 | Exceptional 86.9% |
| Scotch-Irish | 91.6 /100 | #120 | Exceptional 86.8% |
| Immigrants | Lebanon | 90.9 /100 | #121 | Exceptional 86.8% |
| Immigrants | Jordan | 90.8 /100 | #122 | Exceptional 86.8% |