Potawatomi vs Austrian GED/Equivalency
COMPARE
Potawatomi
Austrian
GED/Equivalency
GED/Equivalency Comparison
Potawatomi
Austrians
84.7%
GED/EQUIVALENCY
8.2/ 100
METRIC RATING
219th/ 347
METRIC RANK
87.7%
GED/EQUIVALENCY
98.8/ 100
METRIC RATING
71st/ 347
METRIC RANK
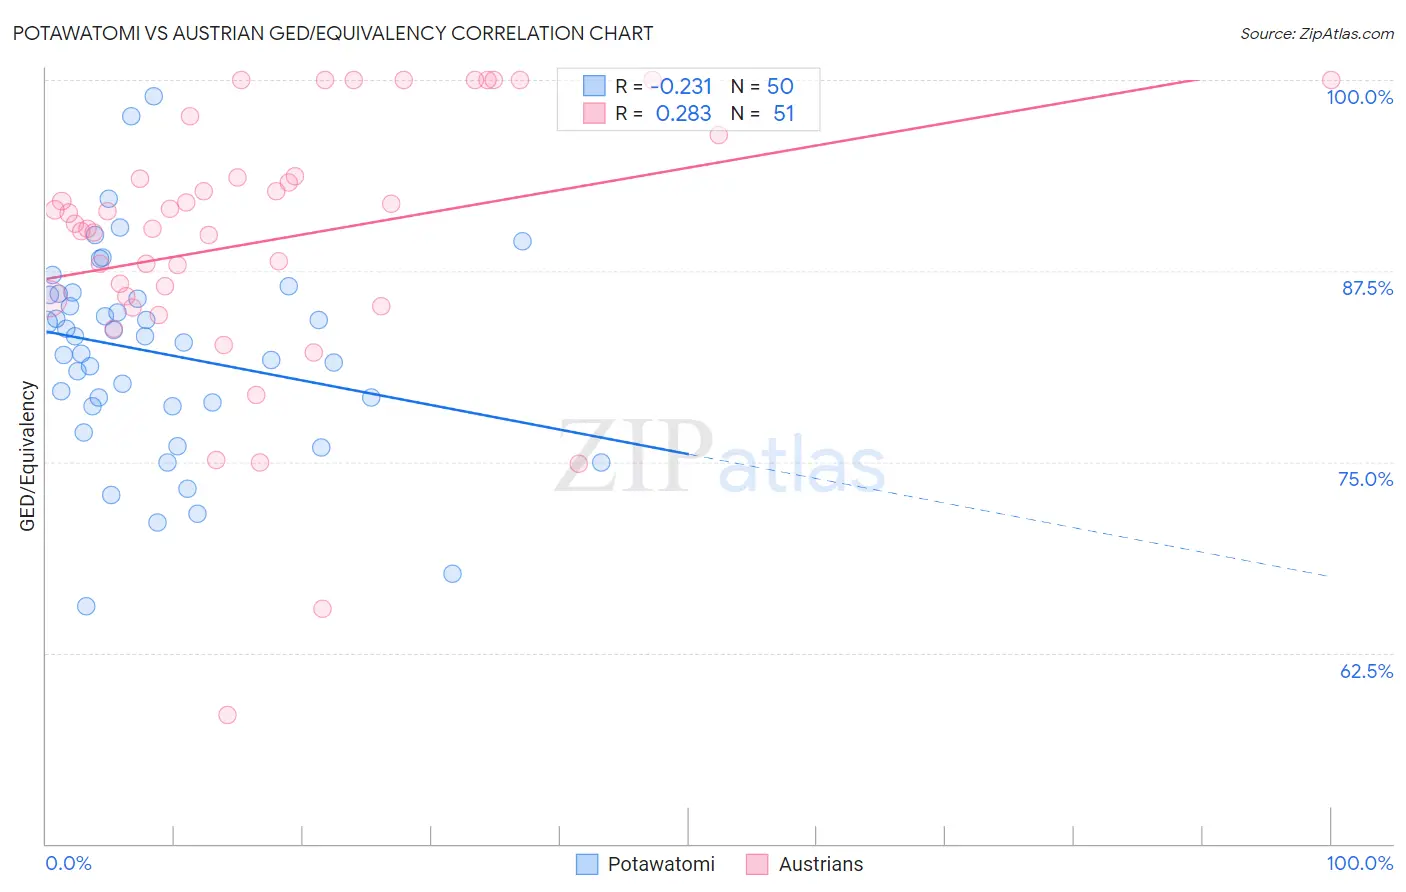
Potawatomi vs Austrian GED/Equivalency Correlation Chart
The statistical analysis conducted on geographies consisting of 117,774,097 people shows a weak negative correlation between the proportion of Potawatomi and percentage of population with at least ged/equivalency education in the United States with a correlation coefficient (R) of -0.231 and weighted average of 84.7%. Similarly, the statistical analysis conducted on geographies consisting of 452,082,927 people shows a weak positive correlation between the proportion of Austrians and percentage of population with at least ged/equivalency education in the United States with a correlation coefficient (R) of 0.283 and weighted average of 87.7%, a difference of 3.6%.
GED/Equivalency Correlation Summary
| Measurement | Potawatomi | Austrian |
| Minimum | 65.6% | 58.5% |
| Maximum | 98.9% | 100.0% |
| Range | 33.3% | 41.5% |
| Mean | 82.1% | 89.5% |
| Median | 83.0% | 90.6% |
| Interquartile 25% (IQ1) | 78.6% | 85.7% |
| Interquartile 75% (IQ3) | 85.9% | 93.7% |
| Interquartile Range (IQR) | 7.3% | 8.0% |
| Standard Deviation (Sample) | 6.7% | 8.8% |
| Standard Deviation (Population) | 6.6% | 8.7% |
Similar Demographics by GED/Equivalency
Demographics Similar to Potawatomi by GED/Equivalency
In terms of ged/equivalency, the demographic groups most similar to Potawatomi are American (84.7%, a difference of 0.0%), Taiwanese (84.7%, a difference of 0.010%), Immigrants from Micronesia (84.7%, a difference of 0.030%), Nigerian (84.7%, a difference of 0.030%), and Alaska Native (84.7%, a difference of 0.030%).
| Demographics | Rating | Rank | GED/Equivalency |
| Immigrants | Somalia | 10.6 /100 | #212 | Poor 84.8% |
| Immigrants | Philippines | 10.0 /100 | #213 | Poor 84.8% |
| Osage | 9.5 /100 | #214 | Tragic 84.8% |
| Peruvians | 9.2 /100 | #215 | Tragic 84.7% |
| Immigrants | Micronesia | 8.7 /100 | #216 | Tragic 84.7% |
| Nigerians | 8.6 /100 | #217 | Tragic 84.7% |
| Alaska Natives | 8.6 /100 | #218 | Tragic 84.7% |
| Potawatomi | 8.2 /100 | #219 | Tragic 84.7% |
| Americans | 8.2 /100 | #220 | Tragic 84.7% |
| Taiwanese | 8.1 /100 | #221 | Tragic 84.7% |
| Iroquois | 7.5 /100 | #222 | Tragic 84.6% |
| Immigrants | Uzbekistan | 7.1 /100 | #223 | Tragic 84.6% |
| French American Indians | 6.3 /100 | #224 | Tragic 84.6% |
| Immigrants | Thailand | 5.8 /100 | #225 | Tragic 84.5% |
| Immigrants | Zaire | 5.5 /100 | #226 | Tragic 84.5% |
Demographics Similar to Austrians by GED/Equivalency
In terms of ged/equivalency, the demographic groups most similar to Austrians are Ukrainian (87.7%, a difference of 0.0%), Immigrants from Moldova (87.7%, a difference of 0.0%), Belgian (87.7%, a difference of 0.010%), Immigrants from Kuwait (87.7%, a difference of 0.030%), and Immigrants from Saudi Arabia (87.8%, a difference of 0.050%).
| Demographics | Rating | Rank | GED/Equivalency |
| Immigrants | Canada | 99.2 /100 | #64 | Exceptional 87.9% |
| Immigrants | North America | 99.1 /100 | #65 | Exceptional 87.8% |
| Immigrants | Bulgaria | 99.1 /100 | #66 | Exceptional 87.8% |
| British | 99.1 /100 | #67 | Exceptional 87.8% |
| Immigrants | France | 99.1 /100 | #68 | Exceptional 87.8% |
| Immigrants | Saudi Arabia | 99.0 /100 | #69 | Exceptional 87.8% |
| Ukrainians | 98.8 /100 | #70 | Exceptional 87.7% |
| Austrians | 98.8 /100 | #71 | Exceptional 87.7% |
| Immigrants | Moldova | 98.8 /100 | #72 | Exceptional 87.7% |
| Belgians | 98.8 /100 | #73 | Exceptional 87.7% |
| Immigrants | Kuwait | 98.8 /100 | #74 | Exceptional 87.7% |
| Scottish | 98.7 /100 | #75 | Exceptional 87.7% |
| Immigrants | Serbia | 98.7 /100 | #76 | Exceptional 87.7% |
| Slavs | 98.7 /100 | #77 | Exceptional 87.7% |
| Irish | 98.6 /100 | #78 | Exceptional 87.6% |