Pima vs Immigrants from Belize High School Diploma
COMPARE
Pima
Immigrants from Belize
High School Diploma
High School Diploma Comparison
Pima
Immigrants from Belize
81.6%
HIGH SCHOOL DIPLOMA
0.0/ 100
METRIC RATING
339th/ 347
METRIC RANK
84.2%
HIGH SCHOOL DIPLOMA
0.0/ 100
METRIC RATING
318th/ 347
METRIC RANK
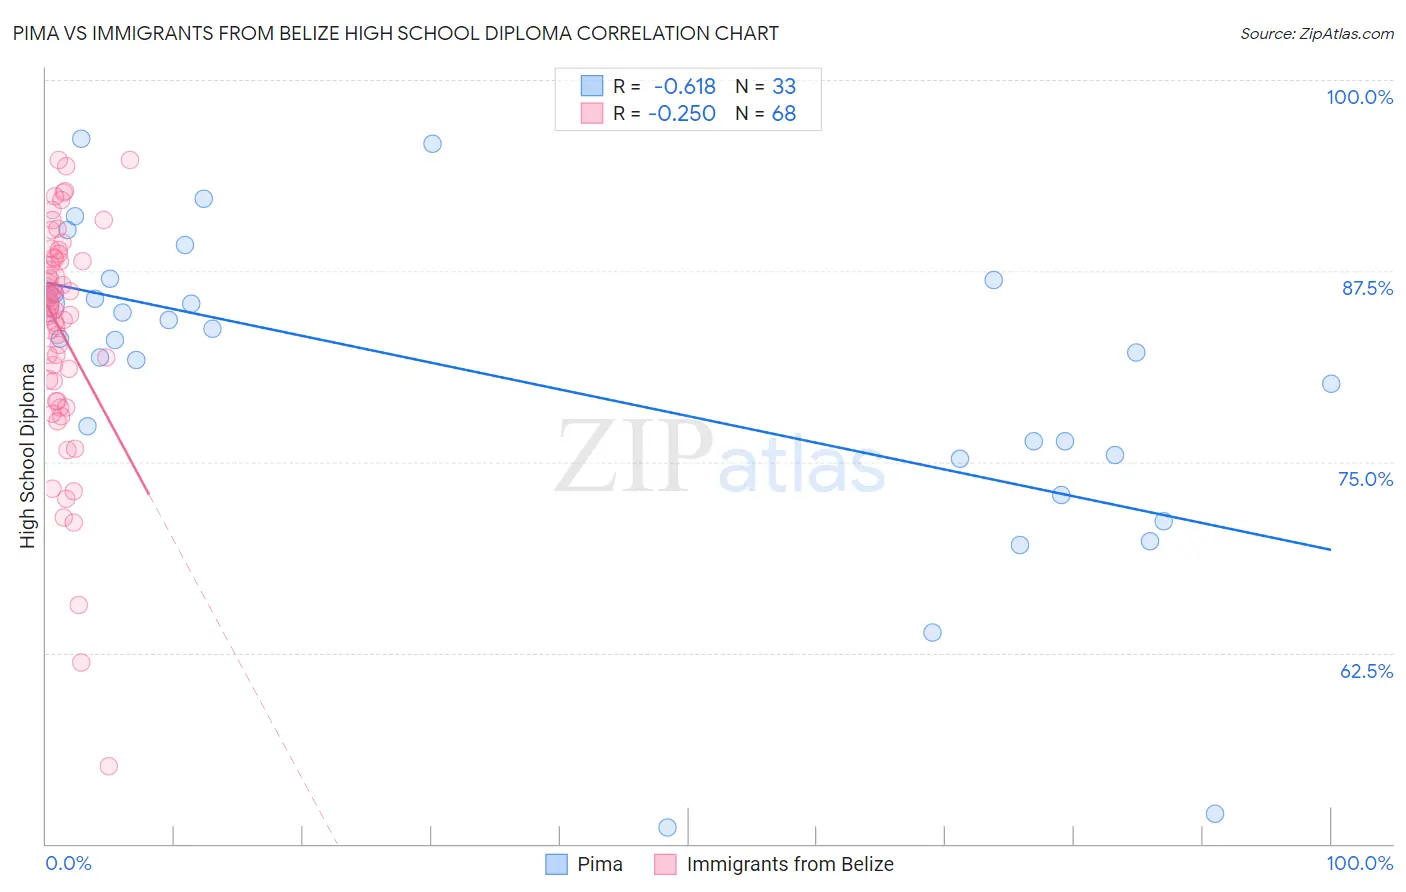
Pima vs Immigrants from Belize High School Diploma Correlation Chart
The statistical analysis conducted on geographies consisting of 61,552,828 people shows a significant negative correlation between the proportion of Pima and percentage of population with at least high school diploma education in the United States with a correlation coefficient (R) of -0.618 and weighted average of 81.6%. Similarly, the statistical analysis conducted on geographies consisting of 130,181,087 people shows a weak negative correlation between the proportion of Immigrants from Belize and percentage of population with at least high school diploma education in the United States with a correlation coefficient (R) of -0.250 and weighted average of 84.2%, a difference of 3.2%.
High School Diploma Correlation Summary
| Measurement | Pima | Immigrants from Belize |
| Minimum | 51.1% | 55.0% |
| Maximum | 96.1% | 94.8% |
| Range | 45.1% | 39.7% |
| Mean | 80.2% | 83.5% |
| Median | 83.0% | 85.1% |
| Interquartile 25% (IQ1) | 75.3% | 79.6% |
| Interquartile 75% (IQ3) | 86.4% | 88.3% |
| Interquartile Range (IQR) | 11.1% | 8.7% |
| Standard Deviation (Sample) | 10.6% | 7.6% |
| Standard Deviation (Population) | 10.4% | 7.5% |
Similar Demographics by High School Diploma
Demographics Similar to Pima by High School Diploma
In terms of high school diploma, the demographic groups most similar to Pima are Salvadoran (81.7%, a difference of 0.10%), Houma (81.5%, a difference of 0.11%), Mexican (81.4%, a difference of 0.26%), Immigrants from Yemen (81.8%, a difference of 0.27%), and Immigrants from Guatemala (81.4%, a difference of 0.31%).
| Demographics | Rating | Rank | High School Diploma |
| Immigrants | Honduras | 0.0 /100 | #332 | Tragic 82.5% |
| Immigrants | Latin America | 0.0 /100 | #333 | Tragic 82.1% |
| Tohono O'odham | 0.0 /100 | #334 | Tragic 82.1% |
| Guatemalans | 0.0 /100 | #335 | Tragic 82.0% |
| Immigrants | Dominican Republic | 0.0 /100 | #336 | Tragic 82.0% |
| Immigrants | Yemen | 0.0 /100 | #337 | Tragic 81.8% |
| Salvadorans | 0.0 /100 | #338 | Tragic 81.7% |
| Pima | 0.0 /100 | #339 | Tragic 81.6% |
| Houma | 0.0 /100 | #340 | Tragic 81.5% |
| Mexicans | 0.0 /100 | #341 | Tragic 81.4% |
| Immigrants | Guatemala | 0.0 /100 | #342 | Tragic 81.4% |
| Immigrants | El Salvador | 0.0 /100 | #343 | Tragic 80.8% |
| Immigrants | Central America | 0.0 /100 | #344 | Tragic 80.1% |
| Yakama | 0.0 /100 | #345 | Tragic 80.0% |
| Spanish American Indians | 0.0 /100 | #346 | Tragic 79.8% |
Demographics Similar to Immigrants from Belize by High School Diploma
In terms of high school diploma, the demographic groups most similar to Immigrants from Belize are Central American Indian (84.2%, a difference of 0.040%), Immigrants from Caribbean (84.3%, a difference of 0.070%), Belizean (84.3%, a difference of 0.13%), Nicaraguan (84.1%, a difference of 0.14%), and Yuman (84.0%, a difference of 0.27%).
| Demographics | Rating | Rank | High School Diploma |
| Ecuadorians | 0.0 /100 | #311 | Tragic 85.1% |
| Cape Verdeans | 0.0 /100 | #312 | Tragic 85.1% |
| Immigrants | Ecuador | 0.0 /100 | #313 | Tragic 84.8% |
| Yaqui | 0.0 /100 | #314 | Tragic 84.7% |
| Puerto Ricans | 0.0 /100 | #315 | Tragic 84.7% |
| Belizeans | 0.0 /100 | #316 | Tragic 84.3% |
| Immigrants | Caribbean | 0.0 /100 | #317 | Tragic 84.3% |
| Immigrants | Belize | 0.0 /100 | #318 | Tragic 84.2% |
| Central American Indians | 0.0 /100 | #319 | Tragic 84.2% |
| Nicaraguans | 0.0 /100 | #320 | Tragic 84.1% |
| Yuman | 0.0 /100 | #321 | Tragic 84.0% |
| Lumbee | 0.0 /100 | #322 | Tragic 83.6% |
| Immigrants | Cuba | 0.0 /100 | #323 | Tragic 83.5% |
| Immigrants | Cabo Verde | 0.0 /100 | #324 | Tragic 83.3% |
| Immigrants | Nicaragua | 0.0 /100 | #325 | Tragic 83.1% |