Puerto Rican vs Trinidadian and Tobagonian High School Diploma
COMPARE
Puerto Rican
Trinidadian and Tobagonian
High School Diploma
High School Diploma Comparison
Puerto Ricans
Trinidadians and Tobagonians
84.7%
HIGH SCHOOL DIPLOMA
0.0/ 100
METRIC RATING
315th/ 347
METRIC RANK
86.9%
HIGH SCHOOL DIPLOMA
0.1/ 100
METRIC RATING
272nd/ 347
METRIC RANK
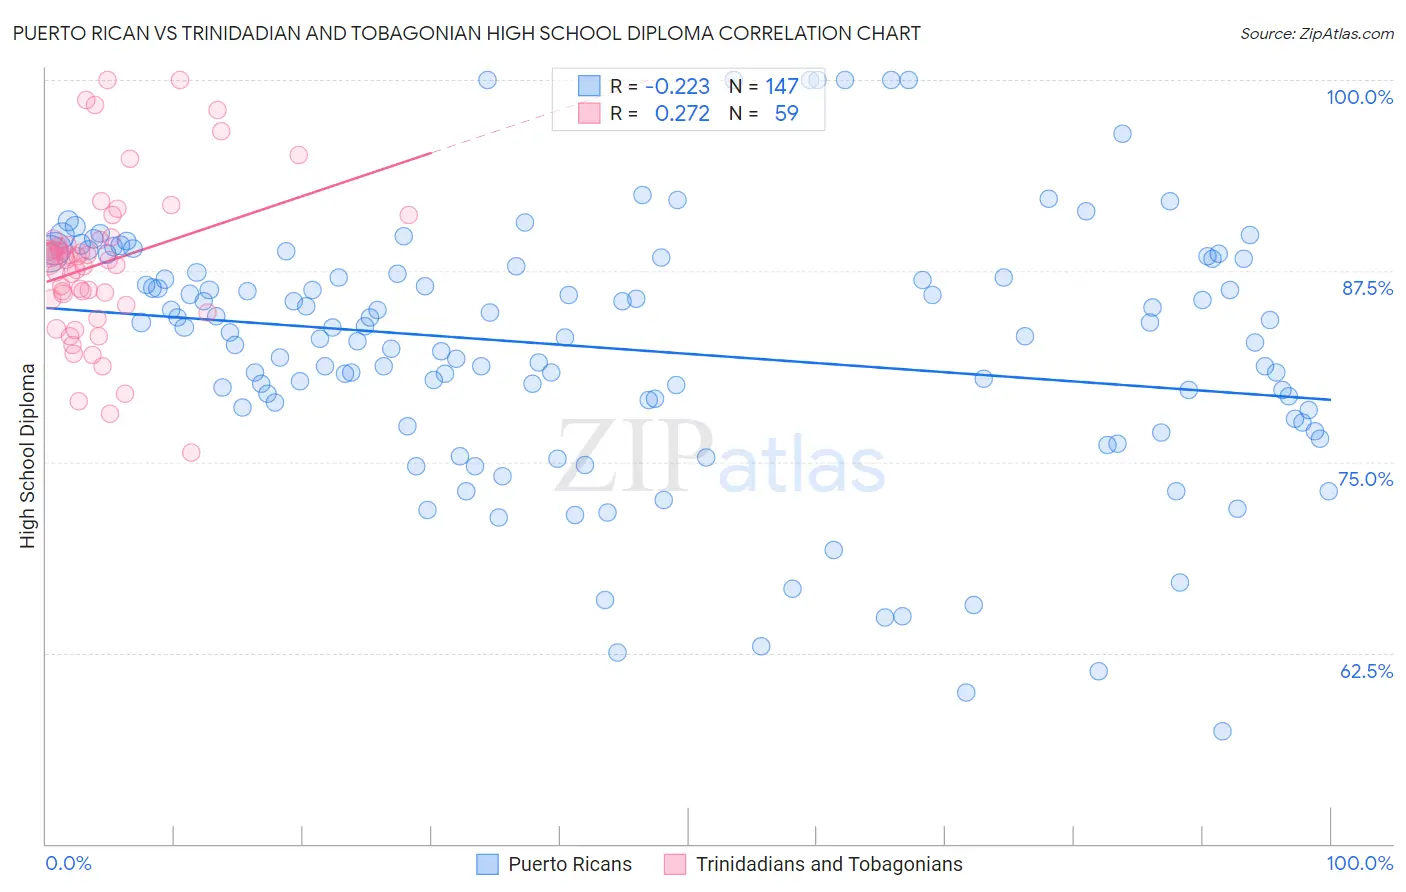
Puerto Rican vs Trinidadian and Tobagonian High School Diploma Correlation Chart
The statistical analysis conducted on geographies consisting of 528,321,094 people shows a weak negative correlation between the proportion of Puerto Ricans and percentage of population with at least high school diploma education in the United States with a correlation coefficient (R) of -0.223 and weighted average of 84.7%. Similarly, the statistical analysis conducted on geographies consisting of 219,881,800 people shows a weak positive correlation between the proportion of Trinidadians and Tobagonians and percentage of population with at least high school diploma education in the United States with a correlation coefficient (R) of 0.272 and weighted average of 86.9%, a difference of 2.7%.
High School Diploma Correlation Summary
| Measurement | Puerto Rican | Trinidadian and Tobagonian |
| Minimum | 57.4% | 75.6% |
| Maximum | 100.0% | 100.0% |
| Range | 42.6% | 24.4% |
| Mean | 82.4% | 88.0% |
| Median | 83.5% | 88.2% |
| Interquartile 25% (IQ1) | 78.4% | 85.3% |
| Interquartile 75% (IQ3) | 87.8% | 89.6% |
| Interquartile Range (IQR) | 9.4% | 4.3% |
| Standard Deviation (Sample) | 8.4% | 5.2% |
| Standard Deviation (Population) | 8.4% | 5.1% |
Similar Demographics by High School Diploma
Demographics Similar to Puerto Ricans by High School Diploma
In terms of high school diploma, the demographic groups most similar to Puerto Ricans are Yaqui (84.7%, a difference of 0.10%), Immigrants from Ecuador (84.8%, a difference of 0.20%), Belizean (84.3%, a difference of 0.40%), Cape Verdean (85.1%, a difference of 0.46%), and Immigrants from Caribbean (84.3%, a difference of 0.46%).
| Demographics | Rating | Rank | High School Diploma |
| Immigrants | Armenia | 0.0 /100 | #308 | Tragic 85.2% |
| Immigrants | Dominica | 0.0 /100 | #309 | Tragic 85.2% |
| Apache | 0.0 /100 | #310 | Tragic 85.1% |
| Ecuadorians | 0.0 /100 | #311 | Tragic 85.1% |
| Cape Verdeans | 0.0 /100 | #312 | Tragic 85.1% |
| Immigrants | Ecuador | 0.0 /100 | #313 | Tragic 84.8% |
| Yaqui | 0.0 /100 | #314 | Tragic 84.7% |
| Puerto Ricans | 0.0 /100 | #315 | Tragic 84.7% |
| Belizeans | 0.0 /100 | #316 | Tragic 84.3% |
| Immigrants | Caribbean | 0.0 /100 | #317 | Tragic 84.3% |
| Immigrants | Belize | 0.0 /100 | #318 | Tragic 84.2% |
| Central American Indians | 0.0 /100 | #319 | Tragic 84.2% |
| Nicaraguans | 0.0 /100 | #320 | Tragic 84.1% |
| Yuman | 0.0 /100 | #321 | Tragic 84.0% |
| Lumbee | 0.0 /100 | #322 | Tragic 83.6% |
Demographics Similar to Trinidadians and Tobagonians by High School Diploma
In terms of high school diploma, the demographic groups most similar to Trinidadians and Tobagonians are West Indian (86.9%, a difference of 0.010%), Immigrants from Jamaica (86.9%, a difference of 0.030%), Bangladeshi (86.9%, a difference of 0.040%), Malaysian (87.0%, a difference of 0.070%), and Sri Lankan (87.0%, a difference of 0.090%).
| Demographics | Rating | Rank | High School Diploma |
| U.S. Virgin Islanders | 0.2 /100 | #265 | Tragic 87.1% |
| Immigrants | Congo | 0.2 /100 | #266 | Tragic 87.0% |
| Blacks/African Americans | 0.2 /100 | #267 | Tragic 87.0% |
| Pennsylvania Germans | 0.2 /100 | #268 | Tragic 87.0% |
| Sri Lankans | 0.2 /100 | #269 | Tragic 87.0% |
| Malaysians | 0.2 /100 | #270 | Tragic 87.0% |
| West Indians | 0.1 /100 | #271 | Tragic 86.9% |
| Trinidadians and Tobagonians | 0.1 /100 | #272 | Tragic 86.9% |
| Immigrants | Jamaica | 0.1 /100 | #273 | Tragic 86.9% |
| Bangladeshis | 0.1 /100 | #274 | Tragic 86.9% |
| Immigrants | Trinidad and Tobago | 0.1 /100 | #275 | Tragic 86.8% |
| Immigrants | Burma/Myanmar | 0.1 /100 | #276 | Tragic 86.7% |
| Barbadians | 0.1 /100 | #277 | Tragic 86.7% |
| Hopi | 0.1 /100 | #278 | Tragic 86.6% |
| Immigrants | Laos | 0.0 /100 | #279 | Tragic 86.6% |