Pima vs Immigrants from Chile High School Diploma
COMPARE
Pima
Immigrants from Chile
High School Diploma
High School Diploma Comparison
Pima
Immigrants from Chile
81.6%
HIGH SCHOOL DIPLOMA
0.0/ 100
METRIC RATING
339th/ 347
METRIC RANK
88.9%
HIGH SCHOOL DIPLOMA
31.9/ 100
METRIC RATING
190th/ 347
METRIC RANK
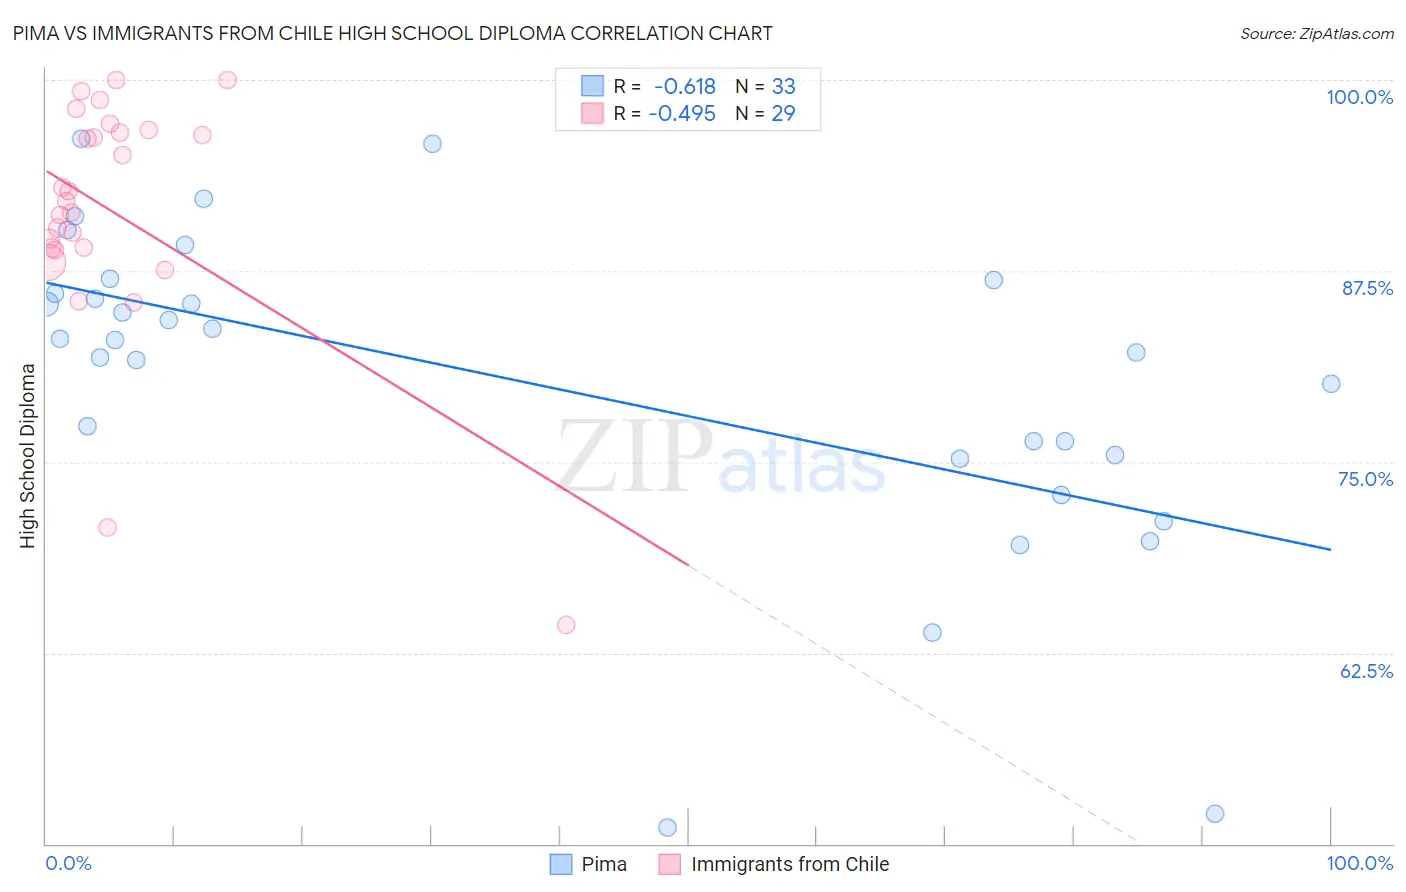
Pima vs Immigrants from Chile High School Diploma Correlation Chart
The statistical analysis conducted on geographies consisting of 61,552,828 people shows a significant negative correlation between the proportion of Pima and percentage of population with at least high school diploma education in the United States with a correlation coefficient (R) of -0.618 and weighted average of 81.6%. Similarly, the statistical analysis conducted on geographies consisting of 218,647,266 people shows a moderate negative correlation between the proportion of Immigrants from Chile and percentage of population with at least high school diploma education in the United States with a correlation coefficient (R) of -0.495 and weighted average of 88.9%, a difference of 8.9%.
High School Diploma Correlation Summary
| Measurement | Pima | Immigrants from Chile |
| Minimum | 51.1% | 64.3% |
| Maximum | 96.1% | 100.0% |
| Range | 45.1% | 35.7% |
| Mean | 80.2% | 91.4% |
| Median | 83.0% | 92.1% |
| Interquartile 25% (IQ1) | 75.3% | 89.0% |
| Interquartile 75% (IQ3) | 86.4% | 96.7% |
| Interquartile Range (IQR) | 11.1% | 7.7% |
| Standard Deviation (Sample) | 10.6% | 8.0% |
| Standard Deviation (Population) | 10.4% | 7.8% |
Similar Demographics by High School Diploma
Demographics Similar to Pima by High School Diploma
In terms of high school diploma, the demographic groups most similar to Pima are Salvadoran (81.7%, a difference of 0.10%), Houma (81.5%, a difference of 0.11%), Mexican (81.4%, a difference of 0.26%), Immigrants from Yemen (81.8%, a difference of 0.27%), and Immigrants from Guatemala (81.4%, a difference of 0.31%).
| Demographics | Rating | Rank | High School Diploma |
| Immigrants | Honduras | 0.0 /100 | #332 | Tragic 82.5% |
| Immigrants | Latin America | 0.0 /100 | #333 | Tragic 82.1% |
| Tohono O'odham | 0.0 /100 | #334 | Tragic 82.1% |
| Guatemalans | 0.0 /100 | #335 | Tragic 82.0% |
| Immigrants | Dominican Republic | 0.0 /100 | #336 | Tragic 82.0% |
| Immigrants | Yemen | 0.0 /100 | #337 | Tragic 81.8% |
| Salvadorans | 0.0 /100 | #338 | Tragic 81.7% |
| Pima | 0.0 /100 | #339 | Tragic 81.6% |
| Houma | 0.0 /100 | #340 | Tragic 81.5% |
| Mexicans | 0.0 /100 | #341 | Tragic 81.4% |
| Immigrants | Guatemala | 0.0 /100 | #342 | Tragic 81.4% |
| Immigrants | El Salvador | 0.0 /100 | #343 | Tragic 80.8% |
| Immigrants | Central America | 0.0 /100 | #344 | Tragic 80.1% |
| Yakama | 0.0 /100 | #345 | Tragic 80.0% |
| Spanish American Indians | 0.0 /100 | #346 | Tragic 79.8% |
Demographics Similar to Immigrants from Chile by High School Diploma
In terms of high school diploma, the demographic groups most similar to Immigrants from Chile are Immigrants from Uganda (88.9%, a difference of 0.010%), Immigrants from Ethiopia (88.9%, a difference of 0.020%), Immigrants from Sudan (88.9%, a difference of 0.030%), Moroccan (88.8%, a difference of 0.040%), and Guamanian/Chamorro (88.9%, a difference of 0.060%).
| Demographics | Rating | Rank | High School Diploma |
| Potawatomi | 42.5 /100 | #183 | Average 89.0% |
| Immigrants | Syria | 39.2 /100 | #184 | Fair 89.0% |
| Ethiopians | 37.0 /100 | #185 | Fair 89.0% |
| Immigrants | Eastern Africa | 35.8 /100 | #186 | Fair 88.9% |
| Guamanians/Chamorros | 35.5 /100 | #187 | Fair 88.9% |
| Immigrants | Sudan | 33.4 /100 | #188 | Fair 88.9% |
| Immigrants | Uganda | 32.6 /100 | #189 | Fair 88.9% |
| Immigrants | Chile | 31.9 /100 | #190 | Fair 88.9% |
| Immigrants | Ethiopia | 30.9 /100 | #191 | Fair 88.9% |
| Moroccans | 29.5 /100 | #192 | Fair 88.8% |
| Immigrants | Oceania | 26.9 /100 | #193 | Fair 88.8% |
| Immigrants | Venezuela | 25.8 /100 | #194 | Fair 88.8% |
| Afghans | 23.9 /100 | #195 | Fair 88.8% |
| Immigrants | Southern Europe | 23.4 /100 | #196 | Fair 88.7% |
| French American Indians | 21.5 /100 | #197 | Fair 88.7% |