Greek vs Trinidadian and Tobagonian High School Diploma
COMPARE
Greek
Trinidadian and Tobagonian
High School Diploma
High School Diploma Comparison
Greeks
Trinidadians and Tobagonians
91.2%
HIGH SCHOOL DIPLOMA
99.8/ 100
METRIC RATING
46th/ 347
METRIC RANK
86.9%
HIGH SCHOOL DIPLOMA
0.1/ 100
METRIC RATING
272nd/ 347
METRIC RANK
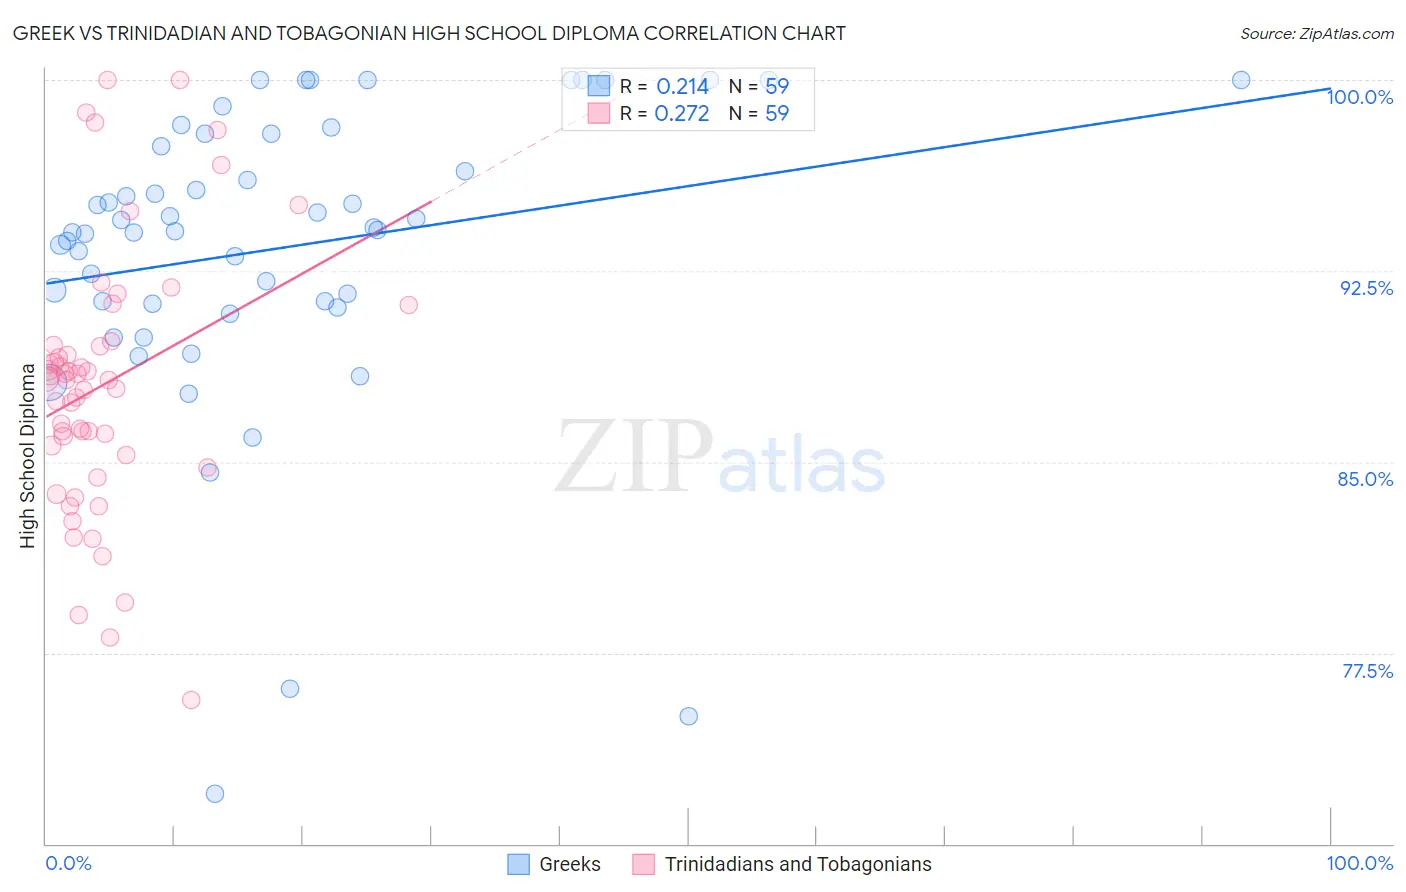
Greek vs Trinidadian and Tobagonian High School Diploma Correlation Chart
The statistical analysis conducted on geographies consisting of 482,775,362 people shows a weak positive correlation between the proportion of Greeks and percentage of population with at least high school diploma education in the United States with a correlation coefficient (R) of 0.214 and weighted average of 91.2%. Similarly, the statistical analysis conducted on geographies consisting of 219,881,800 people shows a weak positive correlation between the proportion of Trinidadians and Tobagonians and percentage of population with at least high school diploma education in the United States with a correlation coefficient (R) of 0.272 and weighted average of 86.9%, a difference of 4.9%.
High School Diploma Correlation Summary
| Measurement | Greek | Trinidadian and Tobagonian |
| Minimum | 72.0% | 75.6% |
| Maximum | 100.0% | 100.0% |
| Range | 28.0% | 24.4% |
| Mean | 93.4% | 88.0% |
| Median | 94.1% | 88.2% |
| Interquartile 25% (IQ1) | 91.2% | 85.3% |
| Interquartile 75% (IQ3) | 97.9% | 89.6% |
| Interquartile Range (IQR) | 6.7% | 4.3% |
| Standard Deviation (Sample) | 5.9% | 5.2% |
| Standard Deviation (Population) | 5.9% | 5.1% |
Similar Demographics by High School Diploma
Demographics Similar to Greeks by High School Diploma
In terms of high school diploma, the demographic groups most similar to Greeks are Australian (91.2%, a difference of 0.010%), Belgian (91.2%, a difference of 0.020%), Bhutanese (91.2%, a difference of 0.020%), Turkish (91.2%, a difference of 0.030%), and Immigrants from Austria (91.3%, a difference of 0.040%).
| Demographics | Rating | Rank | High School Diploma |
| Dutch | 99.8 /100 | #39 | Exceptional 91.3% |
| Immigrants | Lithuania | 99.8 /100 | #40 | Exceptional 91.3% |
| Immigrants | Australia | 99.8 /100 | #41 | Exceptional 91.3% |
| Northern Europeans | 99.8 /100 | #42 | Exceptional 91.3% |
| British | 99.8 /100 | #43 | Exceptional 91.3% |
| Immigrants | Austria | 99.8 /100 | #44 | Exceptional 91.3% |
| Turks | 99.8 /100 | #45 | Exceptional 91.2% |
| Greeks | 99.8 /100 | #46 | Exceptional 91.2% |
| Australians | 99.8 /100 | #47 | Exceptional 91.2% |
| Belgians | 99.8 /100 | #48 | Exceptional 91.2% |
| Bhutanese | 99.8 /100 | #49 | Exceptional 91.2% |
| Welsh | 99.8 /100 | #50 | Exceptional 91.2% |
| New Zealanders | 99.7 /100 | #51 | Exceptional 91.1% |
| Immigrants | Sweden | 99.7 /100 | #52 | Exceptional 91.1% |
| Immigrants | Belgium | 99.7 /100 | #53 | Exceptional 91.1% |
Demographics Similar to Trinidadians and Tobagonians by High School Diploma
In terms of high school diploma, the demographic groups most similar to Trinidadians and Tobagonians are West Indian (86.9%, a difference of 0.010%), Immigrants from Jamaica (86.9%, a difference of 0.030%), Bangladeshi (86.9%, a difference of 0.040%), Malaysian (87.0%, a difference of 0.070%), and Sri Lankan (87.0%, a difference of 0.090%).
| Demographics | Rating | Rank | High School Diploma |
| U.S. Virgin Islanders | 0.2 /100 | #265 | Tragic 87.1% |
| Immigrants | Congo | 0.2 /100 | #266 | Tragic 87.0% |
| Blacks/African Americans | 0.2 /100 | #267 | Tragic 87.0% |
| Pennsylvania Germans | 0.2 /100 | #268 | Tragic 87.0% |
| Sri Lankans | 0.2 /100 | #269 | Tragic 87.0% |
| Malaysians | 0.2 /100 | #270 | Tragic 87.0% |
| West Indians | 0.1 /100 | #271 | Tragic 86.9% |
| Trinidadians and Tobagonians | 0.1 /100 | #272 | Tragic 86.9% |
| Immigrants | Jamaica | 0.1 /100 | #273 | Tragic 86.9% |
| Bangladeshis | 0.1 /100 | #274 | Tragic 86.9% |
| Immigrants | Trinidad and Tobago | 0.1 /100 | #275 | Tragic 86.8% |
| Immigrants | Burma/Myanmar | 0.1 /100 | #276 | Tragic 86.7% |
| Barbadians | 0.1 /100 | #277 | Tragic 86.7% |
| Hopi | 0.1 /100 | #278 | Tragic 86.6% |
| Immigrants | Laos | 0.0 /100 | #279 | Tragic 86.6% |