Immigrants from West Indies vs Trinidadian and Tobagonian High School Diploma
COMPARE
Immigrants from West Indies
Trinidadian and Tobagonian
High School Diploma
High School Diploma Comparison
Immigrants from West Indies
Trinidadians and Tobagonians
86.2%
HIGH SCHOOL DIPLOMA
0.0/ 100
METRIC RATING
285th/ 347
METRIC RANK
86.9%
HIGH SCHOOL DIPLOMA
0.1/ 100
METRIC RATING
272nd/ 347
METRIC RANK
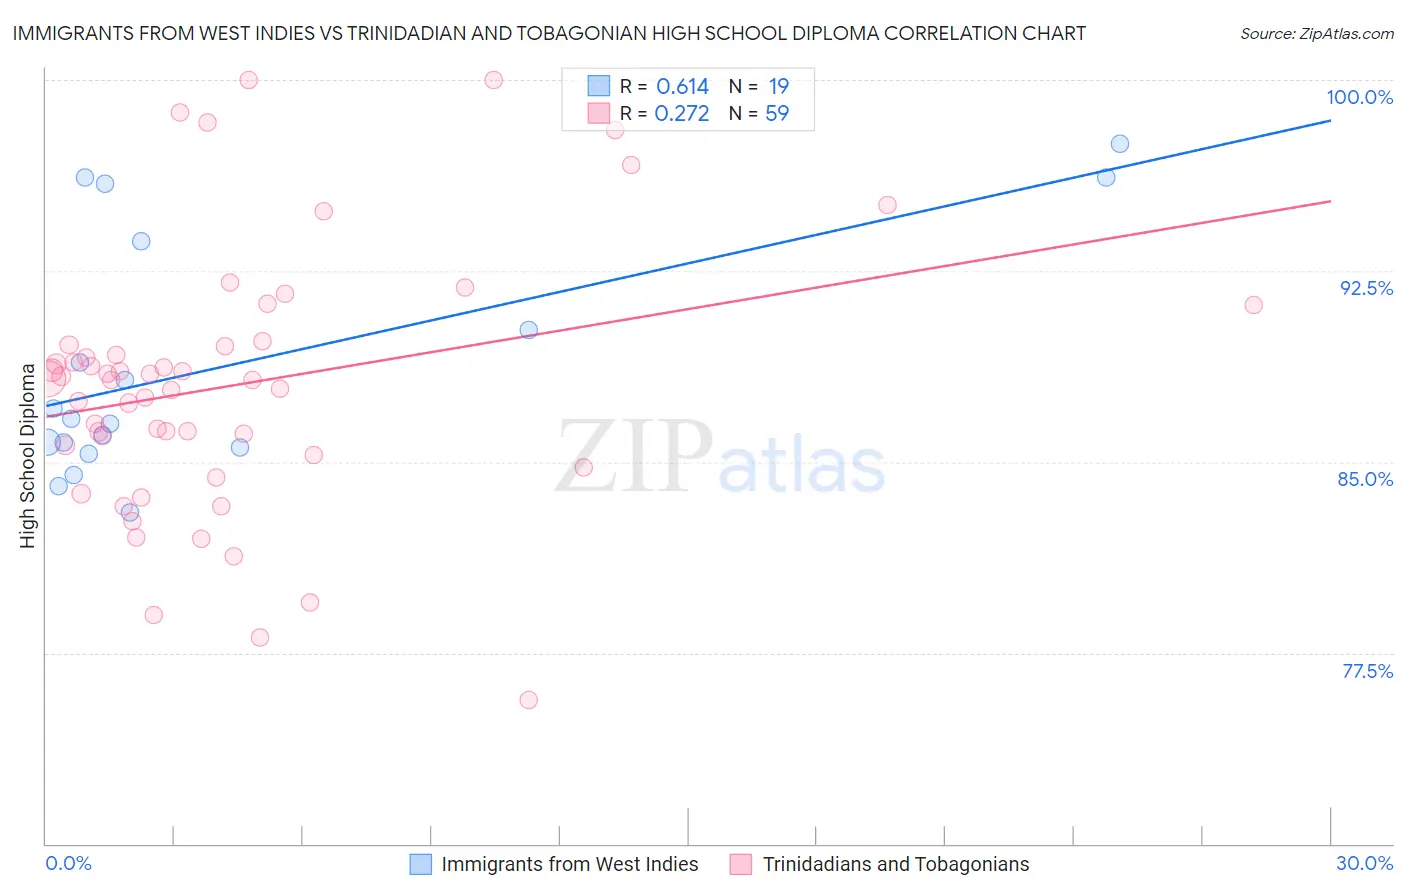
Immigrants from West Indies vs Trinidadian and Tobagonian High School Diploma Correlation Chart
The statistical analysis conducted on geographies consisting of 72,457,514 people shows a significant positive correlation between the proportion of Immigrants from West Indies and percentage of population with at least high school diploma education in the United States with a correlation coefficient (R) of 0.614 and weighted average of 86.2%. Similarly, the statistical analysis conducted on geographies consisting of 219,881,800 people shows a weak positive correlation between the proportion of Trinidadians and Tobagonians and percentage of population with at least high school diploma education in the United States with a correlation coefficient (R) of 0.272 and weighted average of 86.9%, a difference of 0.83%.
High School Diploma Correlation Summary
| Measurement | Immigrants from West Indies | Trinidadian and Tobagonian |
| Minimum | 83.0% | 75.6% |
| Maximum | 97.5% | 100.0% |
| Range | 14.4% | 24.4% |
| Mean | 88.8% | 88.0% |
| Median | 86.7% | 88.2% |
| Interquartile 25% (IQ1) | 85.6% | 85.3% |
| Interquartile 75% (IQ3) | 93.7% | 89.6% |
| Interquartile Range (IQR) | 8.1% | 4.3% |
| Standard Deviation (Sample) | 4.7% | 5.2% |
| Standard Deviation (Population) | 4.6% | 5.1% |
Demographics Similar to Immigrants from West Indies and Trinidadians and Tobagonians by High School Diploma
In terms of high school diploma, the demographic groups most similar to Immigrants from West Indies are Immigrants from St. Vincent and the Grenadines (86.2%, a difference of 0.020%), Ute (86.2%, a difference of 0.060%), Immigrants from Vietnam (86.2%, a difference of 0.060%), Paiute (86.4%, a difference of 0.20%), and Immigrants from Barbados (86.4%, a difference of 0.24%). Similarly, the demographic groups most similar to Trinidadians and Tobagonians are West Indian (86.9%, a difference of 0.010%), Immigrants from Jamaica (86.9%, a difference of 0.030%), Bangladeshi (86.9%, a difference of 0.040%), Malaysian (87.0%, a difference of 0.070%), and Sri Lankan (87.0%, a difference of 0.090%).
| Demographics | Rating | Rank | High School Diploma |
| Pennsylvania Germans | 0.2 /100 | #268 | Tragic 87.0% |
| Sri Lankans | 0.2 /100 | #269 | Tragic 87.0% |
| Malaysians | 0.2 /100 | #270 | Tragic 87.0% |
| West Indians | 0.1 /100 | #271 | Tragic 86.9% |
| Trinidadians and Tobagonians | 0.1 /100 | #272 | Tragic 86.9% |
| Immigrants | Jamaica | 0.1 /100 | #273 | Tragic 86.9% |
| Bangladeshis | 0.1 /100 | #274 | Tragic 86.9% |
| Immigrants | Trinidad and Tobago | 0.1 /100 | #275 | Tragic 86.8% |
| Immigrants | Burma/Myanmar | 0.1 /100 | #276 | Tragic 86.7% |
| Barbadians | 0.1 /100 | #277 | Tragic 86.7% |
| Hopi | 0.1 /100 | #278 | Tragic 86.6% |
| Immigrants | Laos | 0.0 /100 | #279 | Tragic 86.6% |
| Pueblo | 0.0 /100 | #280 | Tragic 86.5% |
| Indonesians | 0.0 /100 | #281 | Tragic 86.5% |
| Dutch West Indians | 0.0 /100 | #282 | Tragic 86.5% |
| Immigrants | Barbados | 0.0 /100 | #283 | Tragic 86.4% |
| Paiute | 0.0 /100 | #284 | Tragic 86.4% |
| Immigrants | West Indies | 0.0 /100 | #285 | Tragic 86.2% |
| Immigrants | St. Vincent and the Grenadines | 0.0 /100 | #286 | Tragic 86.2% |
| Ute | 0.0 /100 | #287 | Tragic 86.2% |
| Immigrants | Vietnam | 0.0 /100 | #288 | Tragic 86.2% |