Pima vs Alsatian High School Diploma
COMPARE
Pima
Alsatian
High School Diploma
High School Diploma Comparison
Pima
Alsatians
81.6%
HIGH SCHOOL DIPLOMA
0.0/ 100
METRIC RATING
339th/ 347
METRIC RANK
89.4%
HIGH SCHOOL DIPLOMA
66.8/ 100
METRIC RATING
154th/ 347
METRIC RANK
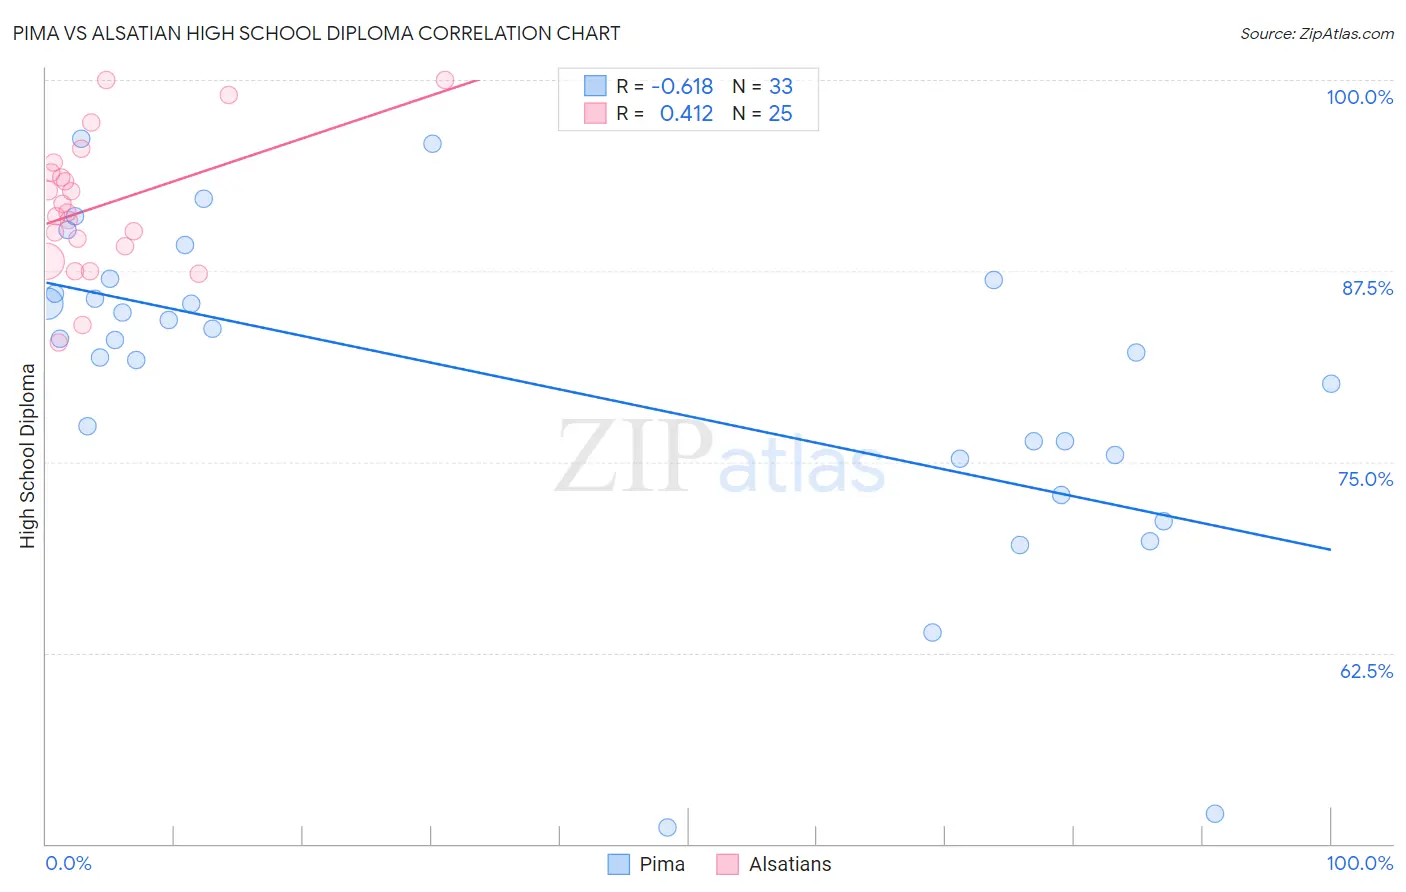
Pima vs Alsatian High School Diploma Correlation Chart
The statistical analysis conducted on geographies consisting of 61,552,828 people shows a significant negative correlation between the proportion of Pima and percentage of population with at least high school diploma education in the United States with a correlation coefficient (R) of -0.618 and weighted average of 81.6%. Similarly, the statistical analysis conducted on geographies consisting of 82,682,365 people shows a moderate positive correlation between the proportion of Alsatians and percentage of population with at least high school diploma education in the United States with a correlation coefficient (R) of 0.412 and weighted average of 89.4%, a difference of 9.5%.
High School Diploma Correlation Summary
| Measurement | Pima | Alsatian |
| Minimum | 51.1% | 82.8% |
| Maximum | 96.1% | 100.0% |
| Range | 45.1% | 17.2% |
| Mean | 80.2% | 91.8% |
| Median | 83.0% | 91.3% |
| Interquartile 25% (IQ1) | 75.3% | 88.6% |
| Interquartile 75% (IQ3) | 86.4% | 94.3% |
| Interquartile Range (IQR) | 11.1% | 5.7% |
| Standard Deviation (Sample) | 10.6% | 4.5% |
| Standard Deviation (Population) | 10.4% | 4.4% |
Similar Demographics by High School Diploma
Demographics Similar to Pima by High School Diploma
In terms of high school diploma, the demographic groups most similar to Pima are Salvadoran (81.7%, a difference of 0.10%), Houma (81.5%, a difference of 0.11%), Mexican (81.4%, a difference of 0.26%), Immigrants from Yemen (81.8%, a difference of 0.27%), and Immigrants from Guatemala (81.4%, a difference of 0.31%).
| Demographics | Rating | Rank | High School Diploma |
| Immigrants | Honduras | 0.0 /100 | #332 | Tragic 82.5% |
| Immigrants | Latin America | 0.0 /100 | #333 | Tragic 82.1% |
| Tohono O'odham | 0.0 /100 | #334 | Tragic 82.1% |
| Guatemalans | 0.0 /100 | #335 | Tragic 82.0% |
| Immigrants | Dominican Republic | 0.0 /100 | #336 | Tragic 82.0% |
| Immigrants | Yemen | 0.0 /100 | #337 | Tragic 81.8% |
| Salvadorans | 0.0 /100 | #338 | Tragic 81.7% |
| Pima | 0.0 /100 | #339 | Tragic 81.6% |
| Houma | 0.0 /100 | #340 | Tragic 81.5% |
| Mexicans | 0.0 /100 | #341 | Tragic 81.4% |
| Immigrants | Guatemala | 0.0 /100 | #342 | Tragic 81.4% |
| Immigrants | El Salvador | 0.0 /100 | #343 | Tragic 80.8% |
| Immigrants | Central America | 0.0 /100 | #344 | Tragic 80.1% |
| Yakama | 0.0 /100 | #345 | Tragic 80.0% |
| Spanish American Indians | 0.0 /100 | #346 | Tragic 79.8% |
Demographics Similar to Alsatians by High School Diploma
In terms of high school diploma, the demographic groups most similar to Alsatians are Immigrants from Northern Africa (89.4%, a difference of 0.010%), Immigrants from Argentina (89.4%, a difference of 0.020%), Immigrants from Iraq (89.4%, a difference of 0.030%), Immigrants from Malaysia (89.3%, a difference of 0.050%), and Asian (89.4%, a difference of 0.070%).
| Demographics | Rating | Rank | High School Diploma |
| Iraqis | 73.9 /100 | #147 | Good 89.5% |
| Immigrants | Lebanon | 73.4 /100 | #148 | Good 89.5% |
| Immigrants | Poland | 72.9 /100 | #149 | Good 89.5% |
| Argentineans | 72.3 /100 | #150 | Good 89.5% |
| Paraguayans | 71.4 /100 | #151 | Good 89.5% |
| Asians | 70.7 /100 | #152 | Good 89.4% |
| Immigrants | Iraq | 68.7 /100 | #153 | Good 89.4% |
| Alsatians | 66.8 /100 | #154 | Good 89.4% |
| Immigrants | Northern Africa | 66.4 /100 | #155 | Good 89.4% |
| Immigrants | Argentina | 65.5 /100 | #156 | Good 89.4% |
| Immigrants | Malaysia | 63.5 /100 | #157 | Good 89.3% |
| Immigrants | Pakistan | 62.5 /100 | #158 | Good 89.3% |
| Immigrants | China | 62.0 /100 | #159 | Good 89.3% |
| Laotians | 61.8 /100 | #160 | Good 89.3% |
| Brazilians | 61.2 /100 | #161 | Good 89.3% |