Malaysian vs Immigrants from Micronesia Associate's Degree
COMPARE
Malaysian
Immigrants from Micronesia
Associate's Degree
Associate's Degree Comparison
Malaysians
Immigrants from Micronesia
41.6%
ASSOCIATE'S DEGREE
0.4/ 100
METRIC RATING
259th/ 347
METRIC RANK
40.2%
ASSOCIATE'S DEGREE
0.1/ 100
METRIC RATING
280th/ 347
METRIC RANK
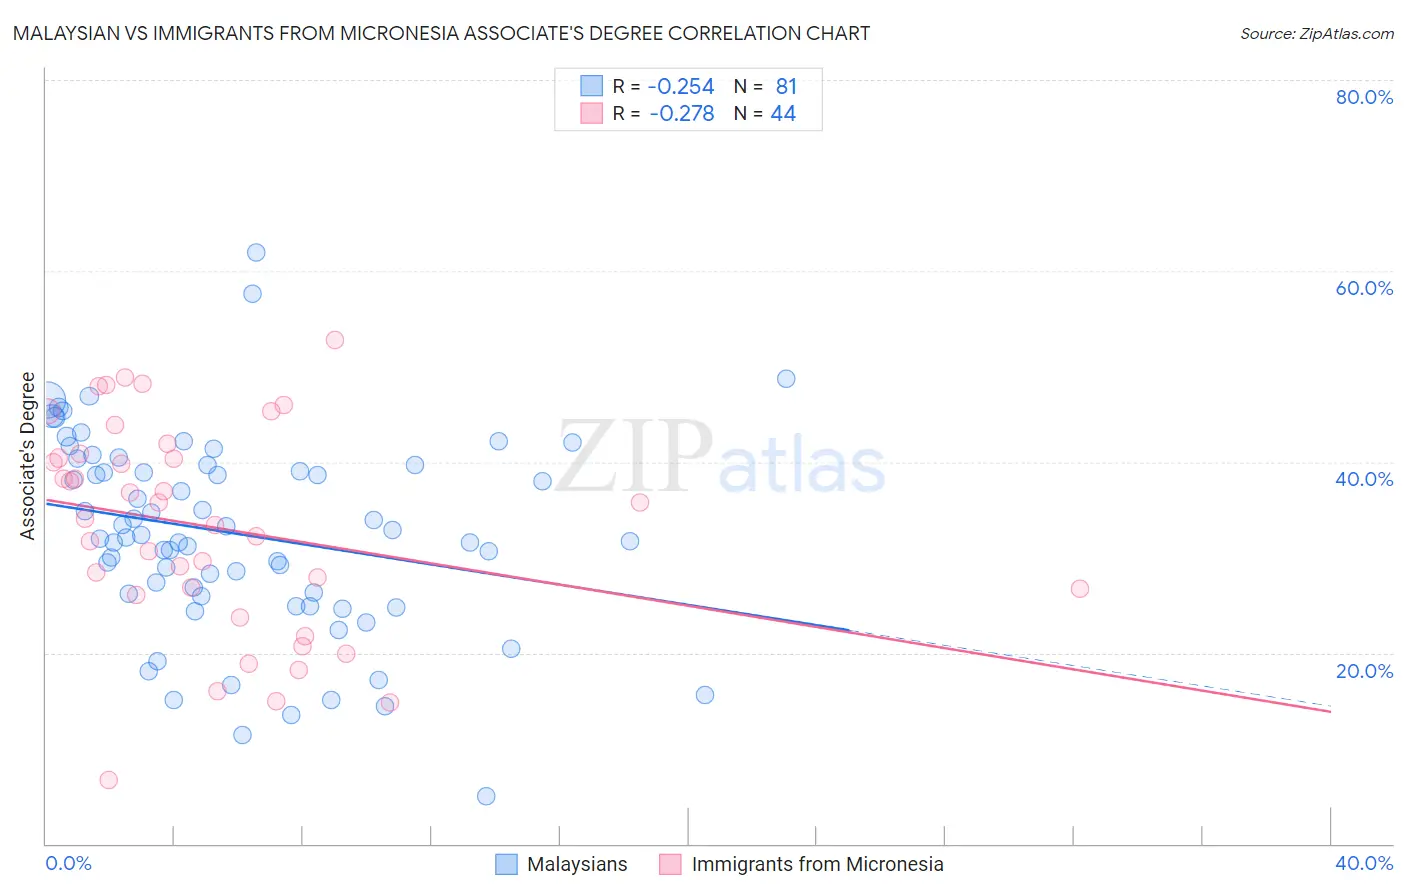
Malaysian vs Immigrants from Micronesia Associate's Degree Correlation Chart
The statistical analysis conducted on geographies consisting of 226,101,912 people shows a weak negative correlation between the proportion of Malaysians and percentage of population with at least associate's degree education in the United States with a correlation coefficient (R) of -0.254 and weighted average of 41.6%. Similarly, the statistical analysis conducted on geographies consisting of 61,609,499 people shows a weak negative correlation between the proportion of Immigrants from Micronesia and percentage of population with at least associate's degree education in the United States with a correlation coefficient (R) of -0.278 and weighted average of 40.2%, a difference of 3.6%.
Associate's Degree Correlation Summary
| Measurement | Malaysian | Immigrants from Micronesia |
| Minimum | 5.0% | 6.6% |
| Maximum | 62.0% | 52.7% |
| Range | 57.0% | 46.1% |
| Mean | 32.4% | 33.2% |
| Median | 32.1% | 34.9% |
| Interquartile 25% (IQ1) | 26.1% | 26.4% |
| Interquartile 75% (IQ3) | 39.7% | 40.6% |
| Interquartile Range (IQR) | 13.6% | 14.2% |
| Standard Deviation (Sample) | 10.4% | 11.0% |
| Standard Deviation (Population) | 10.4% | 10.9% |
Similar Demographics by Associate's Degree
Demographics Similar to Malaysians by Associate's Degree
In terms of associate's degree, the demographic groups most similar to Malaysians are Japanese (41.7%, a difference of 0.10%), Marshallese (41.6%, a difference of 0.19%), Spanish American (41.8%, a difference of 0.32%), Nicaraguan (41.5%, a difference of 0.32%), and Immigrants from Congo (41.8%, a difference of 0.38%).
| Demographics | Rating | Rank | Associate's Degree |
| French American Indians | 0.6 /100 | #252 | Tragic 42.0% |
| Indonesians | 0.6 /100 | #253 | Tragic 41.9% |
| Cubans | 0.6 /100 | #254 | Tragic 41.9% |
| Immigrants | Guyana | 0.5 /100 | #255 | Tragic 41.8% |
| Immigrants | Congo | 0.5 /100 | #256 | Tragic 41.8% |
| Spanish Americans | 0.5 /100 | #257 | Tragic 41.8% |
| Japanese | 0.5 /100 | #258 | Tragic 41.7% |
| Malaysians | 0.4 /100 | #259 | Tragic 41.6% |
| Marshallese | 0.4 /100 | #260 | Tragic 41.6% |
| Nicaraguans | 0.4 /100 | #261 | Tragic 41.5% |
| Bahamians | 0.4 /100 | #262 | Tragic 41.5% |
| Immigrants | Jamaica | 0.3 /100 | #263 | Tragic 41.5% |
| Osage | 0.3 /100 | #264 | Tragic 41.5% |
| Africans | 0.2 /100 | #265 | Tragic 41.1% |
| Samoans | 0.2 /100 | #266 | Tragic 41.1% |
Demographics Similar to Immigrants from Micronesia by Associate's Degree
In terms of associate's degree, the demographic groups most similar to Immigrants from Micronesia are Immigrants from Portugal (40.1%, a difference of 0.10%), Immigrants from Nicaragua (40.3%, a difference of 0.20%), Ottawa (40.3%, a difference of 0.24%), Blackfeet (40.3%, a difference of 0.39%), and Bangladeshi (40.0%, a difference of 0.41%).
| Demographics | Rating | Rank | Associate's Degree |
| Puget Sound Salish | 0.1 /100 | #273 | Tragic 40.5% |
| Immigrants | Dominica | 0.1 /100 | #274 | Tragic 40.5% |
| Potawatomi | 0.1 /100 | #275 | Tragic 40.4% |
| Puerto Ricans | 0.1 /100 | #276 | Tragic 40.4% |
| Blackfeet | 0.1 /100 | #277 | Tragic 40.3% |
| Ottawa | 0.1 /100 | #278 | Tragic 40.3% |
| Immigrants | Nicaragua | 0.1 /100 | #279 | Tragic 40.3% |
| Immigrants | Micronesia | 0.1 /100 | #280 | Tragic 40.2% |
| Immigrants | Portugal | 0.1 /100 | #281 | Tragic 40.1% |
| Bangladeshis | 0.1 /100 | #282 | Tragic 40.0% |
| Haitians | 0.1 /100 | #283 | Tragic 40.0% |
| Comanche | 0.1 /100 | #284 | Tragic 39.9% |
| Immigrants | Belize | 0.1 /100 | #285 | Tragic 39.9% |
| Immigrants | Caribbean | 0.0 /100 | #286 | Tragic 39.7% |
| Aleuts | 0.0 /100 | #287 | Tragic 39.6% |