Guatemalan vs Immigrants from Micronesia Associate's Degree
COMPARE
Guatemalan
Immigrants from Micronesia
Associate's Degree
Associate's Degree Comparison
Guatemalans
Immigrants from Micronesia
38.5%
ASSOCIATE'S DEGREE
0.0/ 100
METRIC RATING
303rd/ 347
METRIC RANK
40.2%
ASSOCIATE'S DEGREE
0.1/ 100
METRIC RATING
280th/ 347
METRIC RANK
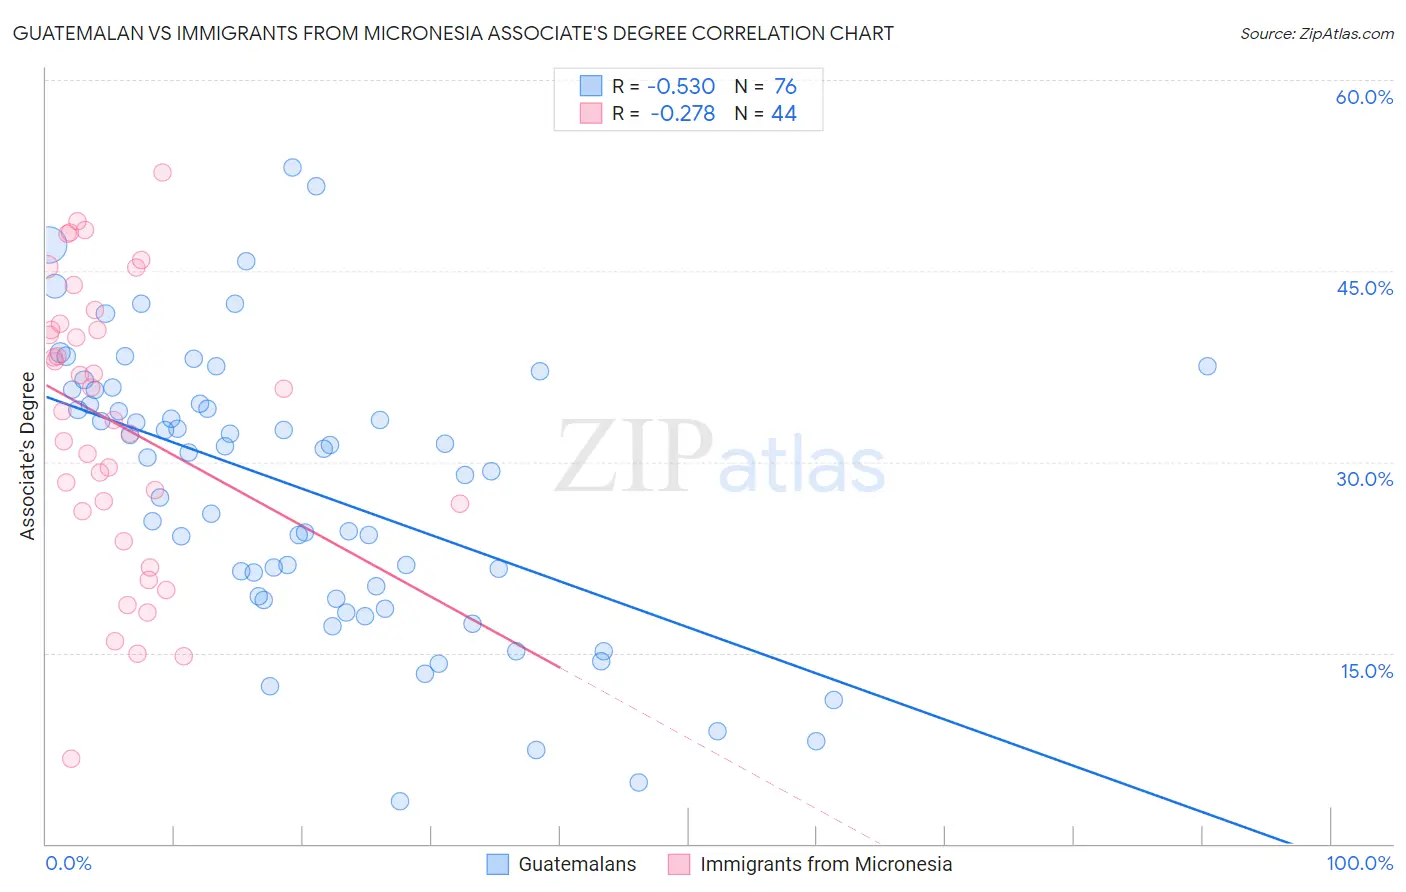
Guatemalan vs Immigrants from Micronesia Associate's Degree Correlation Chart
The statistical analysis conducted on geographies consisting of 409,533,584 people shows a substantial negative correlation between the proportion of Guatemalans and percentage of population with at least associate's degree education in the United States with a correlation coefficient (R) of -0.530 and weighted average of 38.5%. Similarly, the statistical analysis conducted on geographies consisting of 61,609,499 people shows a weak negative correlation between the proportion of Immigrants from Micronesia and percentage of population with at least associate's degree education in the United States with a correlation coefficient (R) of -0.278 and weighted average of 40.2%, a difference of 4.4%.
Associate's Degree Correlation Summary
| Measurement | Guatemalan | Immigrants from Micronesia |
| Minimum | 3.3% | 6.6% |
| Maximum | 53.1% | 52.7% |
| Range | 49.8% | 46.1% |
| Mean | 27.8% | 33.2% |
| Median | 30.6% | 34.9% |
| Interquartile 25% (IQ1) | 19.3% | 26.4% |
| Interquartile 75% (IQ3) | 35.1% | 40.6% |
| Interquartile Range (IQR) | 15.8% | 14.2% |
| Standard Deviation (Sample) | 11.0% | 11.0% |
| Standard Deviation (Population) | 10.9% | 10.9% |
Similar Demographics by Associate's Degree
Demographics Similar to Guatemalans by Associate's Degree
In terms of associate's degree, the demographic groups most similar to Guatemalans are Sioux (38.5%, a difference of 0.050%), Colville (38.5%, a difference of 0.090%), Immigrants from Honduras (38.5%, a difference of 0.12%), Shoshone (38.4%, a difference of 0.19%), and Immigrants from El Salvador (38.4%, a difference of 0.23%).
| Demographics | Rating | Rank | Associate's Degree |
| Cherokee | 0.0 /100 | #296 | Tragic 38.9% |
| Cape Verdeans | 0.0 /100 | #297 | Tragic 38.8% |
| Cheyenne | 0.0 /100 | #298 | Tragic 38.7% |
| Ute | 0.0 /100 | #299 | Tragic 38.6% |
| Chickasaw | 0.0 /100 | #300 | Tragic 38.6% |
| Tsimshian | 0.0 /100 | #301 | Tragic 38.6% |
| Colville | 0.0 /100 | #302 | Tragic 38.5% |
| Guatemalans | 0.0 /100 | #303 | Tragic 38.5% |
| Sioux | 0.0 /100 | #304 | Tragic 38.5% |
| Immigrants | Honduras | 0.0 /100 | #305 | Tragic 38.5% |
| Shoshone | 0.0 /100 | #306 | Tragic 38.4% |
| Immigrants | El Salvador | 0.0 /100 | #307 | Tragic 38.4% |
| Mexican American Indians | 0.0 /100 | #308 | Tragic 38.2% |
| Immigrants | Guatemala | 0.0 /100 | #309 | Tragic 38.1% |
| Immigrants | Dominican Republic | 0.0 /100 | #310 | Tragic 37.9% |
Demographics Similar to Immigrants from Micronesia by Associate's Degree
In terms of associate's degree, the demographic groups most similar to Immigrants from Micronesia are Immigrants from Portugal (40.1%, a difference of 0.10%), Immigrants from Nicaragua (40.3%, a difference of 0.20%), Ottawa (40.3%, a difference of 0.24%), Blackfeet (40.3%, a difference of 0.39%), and Bangladeshi (40.0%, a difference of 0.41%).
| Demographics | Rating | Rank | Associate's Degree |
| Puget Sound Salish | 0.1 /100 | #273 | Tragic 40.5% |
| Immigrants | Dominica | 0.1 /100 | #274 | Tragic 40.5% |
| Potawatomi | 0.1 /100 | #275 | Tragic 40.4% |
| Puerto Ricans | 0.1 /100 | #276 | Tragic 40.4% |
| Blackfeet | 0.1 /100 | #277 | Tragic 40.3% |
| Ottawa | 0.1 /100 | #278 | Tragic 40.3% |
| Immigrants | Nicaragua | 0.1 /100 | #279 | Tragic 40.3% |
| Immigrants | Micronesia | 0.1 /100 | #280 | Tragic 40.2% |
| Immigrants | Portugal | 0.1 /100 | #281 | Tragic 40.1% |
| Bangladeshis | 0.1 /100 | #282 | Tragic 40.0% |
| Haitians | 0.1 /100 | #283 | Tragic 40.0% |
| Comanche | 0.1 /100 | #284 | Tragic 39.9% |
| Immigrants | Belize | 0.1 /100 | #285 | Tragic 39.9% |
| Immigrants | Caribbean | 0.0 /100 | #286 | Tragic 39.7% |
| Aleuts | 0.0 /100 | #287 | Tragic 39.6% |