Chilean vs Immigrants from Micronesia Associate's Degree
COMPARE
Chilean
Immigrants from Micronesia
Associate's Degree
Associate's Degree Comparison
Chileans
Immigrants from Micronesia
49.4%
ASSOCIATE'S DEGREE
97.3/ 100
METRIC RATING
102nd/ 347
METRIC RANK
40.2%
ASSOCIATE'S DEGREE
0.1/ 100
METRIC RATING
280th/ 347
METRIC RANK
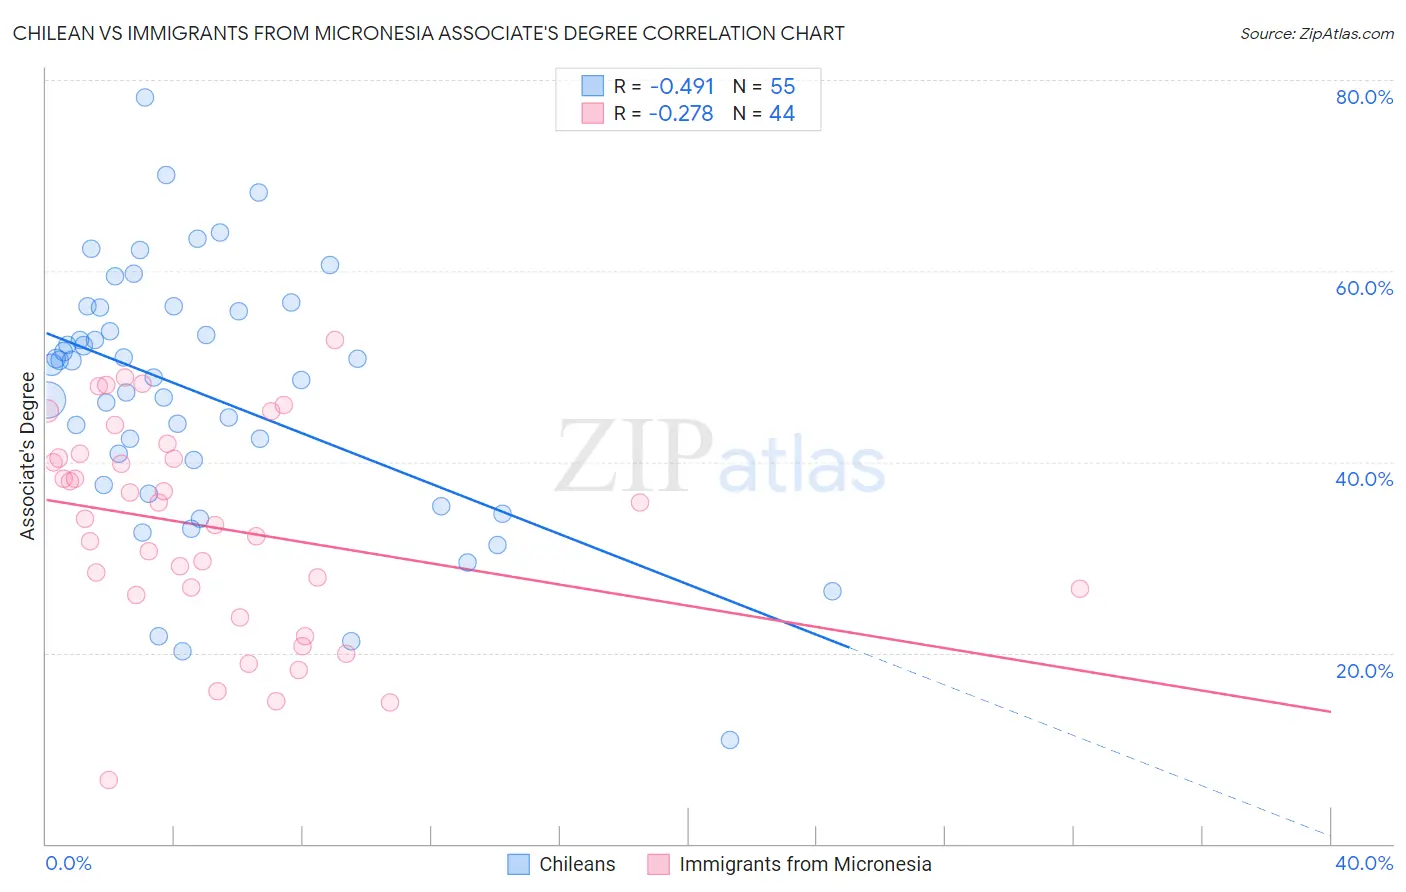
Chilean vs Immigrants from Micronesia Associate's Degree Correlation Chart
The statistical analysis conducted on geographies consisting of 256,684,279 people shows a moderate negative correlation between the proportion of Chileans and percentage of population with at least associate's degree education in the United States with a correlation coefficient (R) of -0.491 and weighted average of 49.4%. Similarly, the statistical analysis conducted on geographies consisting of 61,609,499 people shows a weak negative correlation between the proportion of Immigrants from Micronesia and percentage of population with at least associate's degree education in the United States with a correlation coefficient (R) of -0.278 and weighted average of 40.2%, a difference of 23.1%.
Associate's Degree Correlation Summary
| Measurement | Chilean | Immigrants from Micronesia |
| Minimum | 10.9% | 6.6% |
| Maximum | 78.2% | 52.7% |
| Range | 67.3% | 46.1% |
| Mean | 47.1% | 33.2% |
| Median | 50.2% | 34.9% |
| Interquartile 25% (IQ1) | 37.6% | 26.4% |
| Interquartile 75% (IQ3) | 56.1% | 40.6% |
| Interquartile Range (IQR) | 18.5% | 14.2% |
| Standard Deviation (Sample) | 13.4% | 11.0% |
| Standard Deviation (Population) | 13.3% | 10.9% |
Similar Demographics by Associate's Degree
Demographics Similar to Chileans by Associate's Degree
In terms of associate's degree, the demographic groups most similar to Chileans are Northern European (49.5%, a difference of 0.030%), Ukrainian (49.4%, a difference of 0.11%), Venezuelan (49.4%, a difference of 0.17%), Immigrants from Nepal (49.5%, a difference of 0.19%), and Croatian (49.3%, a difference of 0.31%).
| Demographics | Rating | Rank | Associate's Degree |
| Immigrants | England | 98.0 /100 | #95 | Exceptional 49.7% |
| Romanians | 98.0 /100 | #96 | Exceptional 49.7% |
| Immigrants | Ukraine | 98.0 /100 | #97 | Exceptional 49.7% |
| Immigrants | Northern Africa | 97.9 /100 | #98 | Exceptional 49.7% |
| Macedonians | 97.8 /100 | #99 | Exceptional 49.6% |
| Immigrants | Nepal | 97.5 /100 | #100 | Exceptional 49.5% |
| Northern Europeans | 97.3 /100 | #101 | Exceptional 49.5% |
| Chileans | 97.3 /100 | #102 | Exceptional 49.4% |
| Ukrainians | 97.1 /100 | #103 | Exceptional 49.4% |
| Venezuelans | 97.0 /100 | #104 | Exceptional 49.4% |
| Croatians | 96.8 /100 | #105 | Exceptional 49.3% |
| Immigrants | Italy | 96.7 /100 | #106 | Exceptional 49.3% |
| Syrians | 96.7 /100 | #107 | Exceptional 49.3% |
| Jordanians | 96.6 /100 | #108 | Exceptional 49.2% |
| Immigrants | Morocco | 96.3 /100 | #109 | Exceptional 49.2% |
Demographics Similar to Immigrants from Micronesia by Associate's Degree
In terms of associate's degree, the demographic groups most similar to Immigrants from Micronesia are Immigrants from Portugal (40.1%, a difference of 0.10%), Immigrants from Nicaragua (40.3%, a difference of 0.20%), Ottawa (40.3%, a difference of 0.24%), Blackfeet (40.3%, a difference of 0.39%), and Bangladeshi (40.0%, a difference of 0.41%).
| Demographics | Rating | Rank | Associate's Degree |
| Puget Sound Salish | 0.1 /100 | #273 | Tragic 40.5% |
| Immigrants | Dominica | 0.1 /100 | #274 | Tragic 40.5% |
| Potawatomi | 0.1 /100 | #275 | Tragic 40.4% |
| Puerto Ricans | 0.1 /100 | #276 | Tragic 40.4% |
| Blackfeet | 0.1 /100 | #277 | Tragic 40.3% |
| Ottawa | 0.1 /100 | #278 | Tragic 40.3% |
| Immigrants | Nicaragua | 0.1 /100 | #279 | Tragic 40.3% |
| Immigrants | Micronesia | 0.1 /100 | #280 | Tragic 40.2% |
| Immigrants | Portugal | 0.1 /100 | #281 | Tragic 40.1% |
| Bangladeshis | 0.1 /100 | #282 | Tragic 40.0% |
| Haitians | 0.1 /100 | #283 | Tragic 40.0% |
| Comanche | 0.1 /100 | #284 | Tragic 39.9% |
| Immigrants | Belize | 0.1 /100 | #285 | Tragic 39.9% |
| Immigrants | Caribbean | 0.0 /100 | #286 | Tragic 39.7% |
| Aleuts | 0.0 /100 | #287 | Tragic 39.6% |