Bhutanese vs Immigrants from Micronesia Associate's Degree
COMPARE
Bhutanese
Immigrants from Micronesia
Associate's Degree
Associate's Degree Comparison
Bhutanese
Immigrants from Micronesia
51.4%
ASSOCIATE'S DEGREE
99.7/ 100
METRIC RATING
62nd/ 347
METRIC RANK
40.2%
ASSOCIATE'S DEGREE
0.1/ 100
METRIC RATING
280th/ 347
METRIC RANK
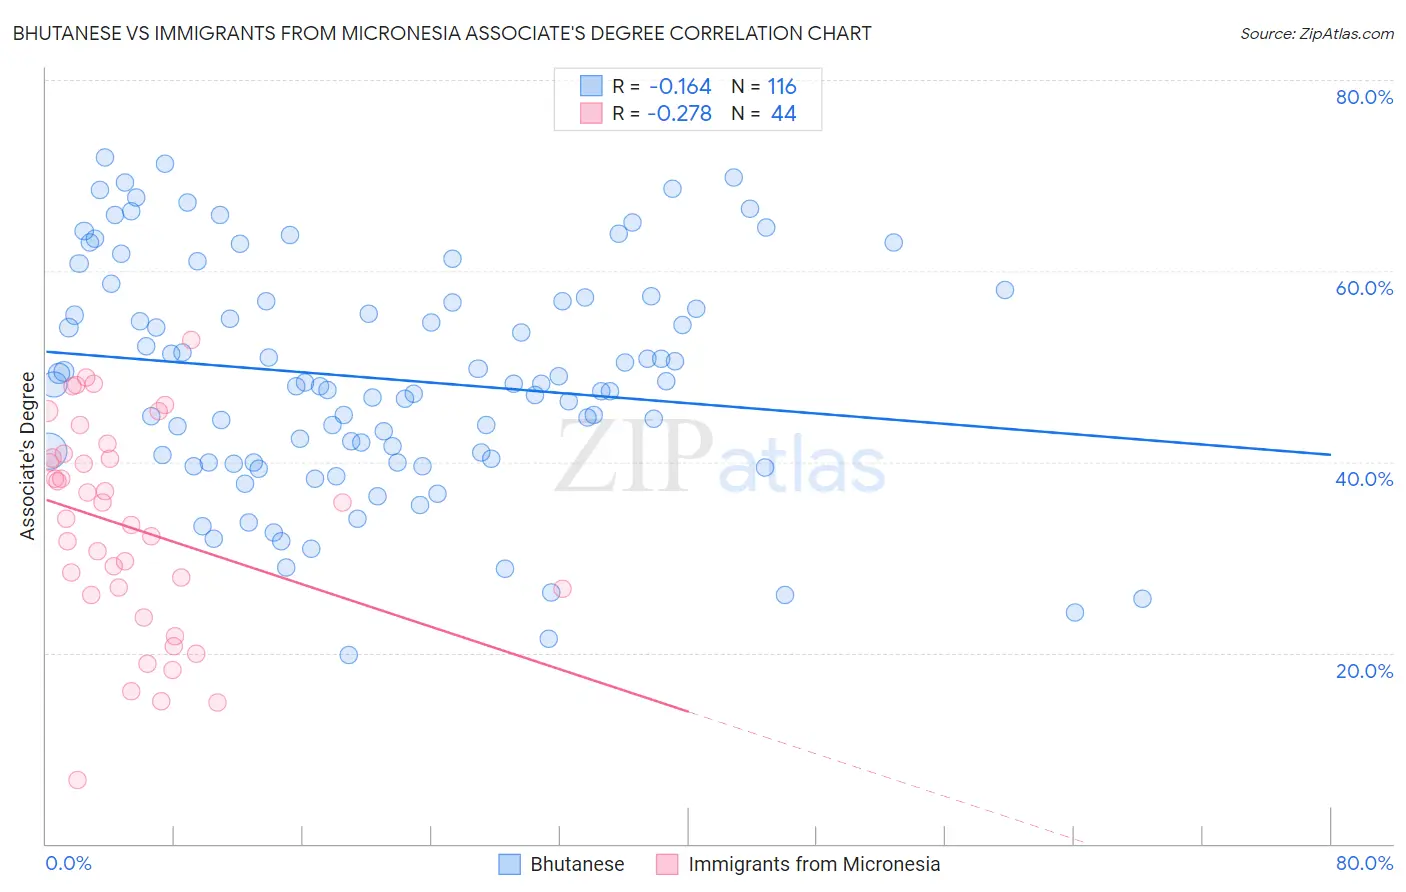
Bhutanese vs Immigrants from Micronesia Associate's Degree Correlation Chart
The statistical analysis conducted on geographies consisting of 455,542,651 people shows a poor negative correlation between the proportion of Bhutanese and percentage of population with at least associate's degree education in the United States with a correlation coefficient (R) of -0.164 and weighted average of 51.4%. Similarly, the statistical analysis conducted on geographies consisting of 61,609,499 people shows a weak negative correlation between the proportion of Immigrants from Micronesia and percentage of population with at least associate's degree education in the United States with a correlation coefficient (R) of -0.278 and weighted average of 40.2%, a difference of 28.0%.
Associate's Degree Correlation Summary
| Measurement | Bhutanese | Immigrants from Micronesia |
| Minimum | 19.7% | 6.6% |
| Maximum | 71.8% | 52.7% |
| Range | 52.1% | 46.1% |
| Mean | 48.7% | 33.2% |
| Median | 48.1% | 34.9% |
| Interquartile 25% (IQ1) | 40.1% | 26.4% |
| Interquartile 75% (IQ3) | 57.0% | 40.6% |
| Interquartile Range (IQR) | 16.9% | 14.2% |
| Standard Deviation (Sample) | 12.0% | 11.0% |
| Standard Deviation (Population) | 12.0% | 10.9% |
Similar Demographics by Associate's Degree
Demographics Similar to Bhutanese by Associate's Degree
In terms of associate's degree, the demographic groups most similar to Bhutanese are Immigrants from Kazakhstan (51.4%, a difference of 0.0%), South African (51.4%, a difference of 0.050%), Immigrants from Netherlands (51.4%, a difference of 0.13%), Immigrants from Bolivia (51.5%, a difference of 0.15%), and Zimbabwean (51.3%, a difference of 0.16%).
| Demographics | Rating | Rank | Associate's Degree |
| Australians | 99.8 /100 | #55 | Exceptional 51.9% |
| Immigrants | Czechoslovakia | 99.8 /100 | #56 | Exceptional 51.9% |
| Paraguayans | 99.8 /100 | #57 | Exceptional 51.8% |
| New Zealanders | 99.8 /100 | #58 | Exceptional 51.8% |
| Immigrants | Serbia | 99.8 /100 | #59 | Exceptional 51.7% |
| Immigrants | Bolivia | 99.7 /100 | #60 | Exceptional 51.5% |
| Immigrants | Kazakhstan | 99.7 /100 | #61 | Exceptional 51.4% |
| Bhutanese | 99.7 /100 | #62 | Exceptional 51.4% |
| South Africans | 99.7 /100 | #63 | Exceptional 51.4% |
| Immigrants | Netherlands | 99.7 /100 | #64 | Exceptional 51.4% |
| Zimbabweans | 99.7 /100 | #65 | Exceptional 51.3% |
| Immigrants | Europe | 99.7 /100 | #66 | Exceptional 51.3% |
| Argentineans | 99.6 /100 | #67 | Exceptional 51.2% |
| Immigrants | Indonesia | 99.5 /100 | #68 | Exceptional 51.0% |
| Egyptians | 99.5 /100 | #69 | Exceptional 50.9% |
Demographics Similar to Immigrants from Micronesia by Associate's Degree
In terms of associate's degree, the demographic groups most similar to Immigrants from Micronesia are Immigrants from Portugal (40.1%, a difference of 0.10%), Immigrants from Nicaragua (40.3%, a difference of 0.20%), Ottawa (40.3%, a difference of 0.24%), Blackfeet (40.3%, a difference of 0.39%), and Bangladeshi (40.0%, a difference of 0.41%).
| Demographics | Rating | Rank | Associate's Degree |
| Puget Sound Salish | 0.1 /100 | #273 | Tragic 40.5% |
| Immigrants | Dominica | 0.1 /100 | #274 | Tragic 40.5% |
| Potawatomi | 0.1 /100 | #275 | Tragic 40.4% |
| Puerto Ricans | 0.1 /100 | #276 | Tragic 40.4% |
| Blackfeet | 0.1 /100 | #277 | Tragic 40.3% |
| Ottawa | 0.1 /100 | #278 | Tragic 40.3% |
| Immigrants | Nicaragua | 0.1 /100 | #279 | Tragic 40.3% |
| Immigrants | Micronesia | 0.1 /100 | #280 | Tragic 40.2% |
| Immigrants | Portugal | 0.1 /100 | #281 | Tragic 40.1% |
| Bangladeshis | 0.1 /100 | #282 | Tragic 40.0% |
| Haitians | 0.1 /100 | #283 | Tragic 40.0% |
| Comanche | 0.1 /100 | #284 | Tragic 39.9% |
| Immigrants | Belize | 0.1 /100 | #285 | Tragic 39.9% |
| Immigrants | Caribbean | 0.0 /100 | #286 | Tragic 39.7% |
| Aleuts | 0.0 /100 | #287 | Tragic 39.6% |