Immigrants from Africa vs Immigrants from Micronesia Associate's Degree
COMPARE
Immigrants from Africa
Immigrants from Micronesia
Associate's Degree
Associate's Degree Comparison
Immigrants from Africa
Immigrants from Micronesia
46.8%
ASSOCIATE'S DEGREE
63.2/ 100
METRIC RATING
162nd/ 347
METRIC RANK
40.2%
ASSOCIATE'S DEGREE
0.1/ 100
METRIC RATING
280th/ 347
METRIC RANK
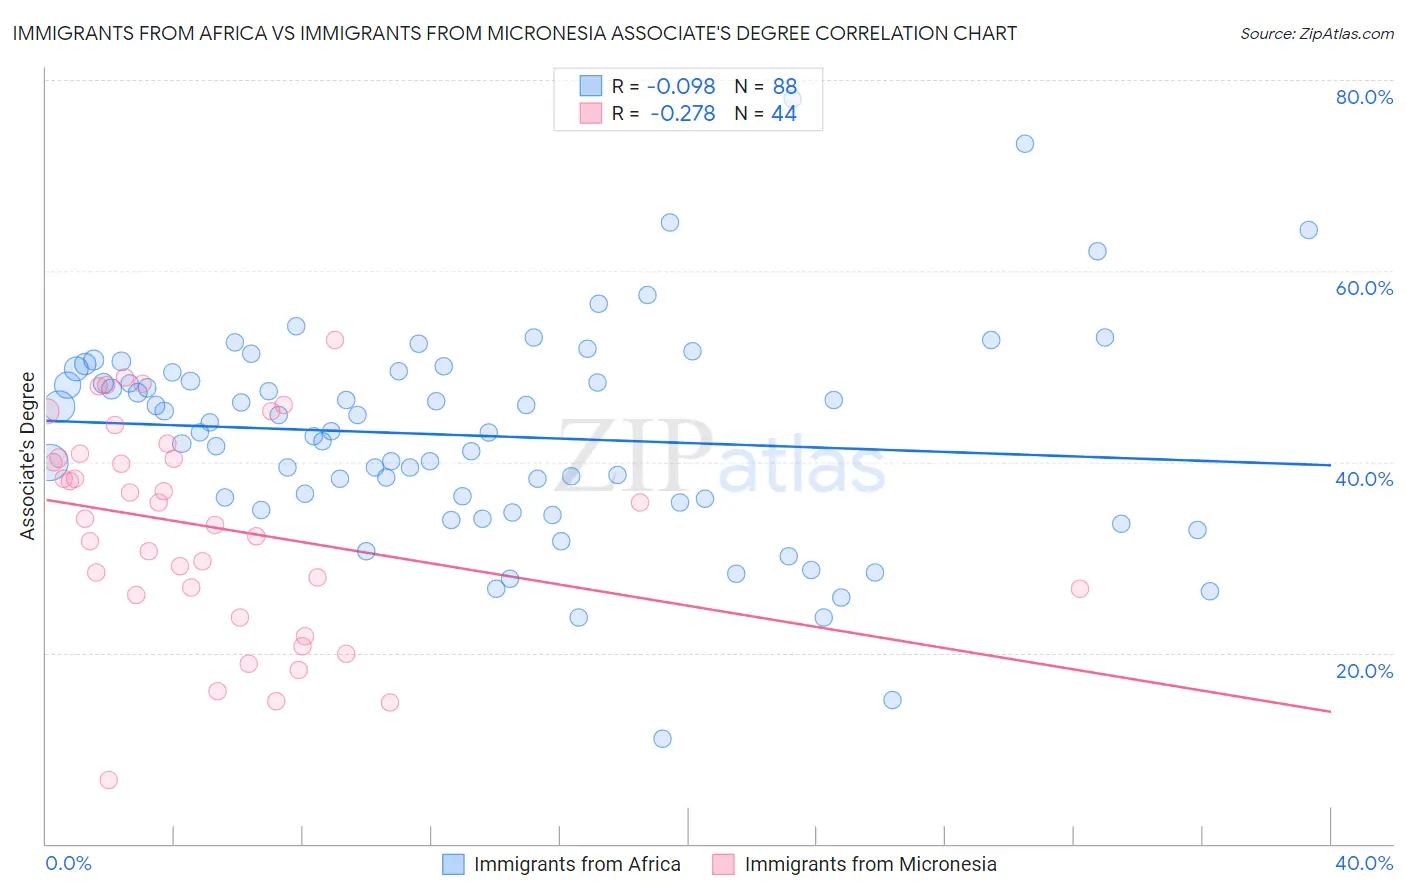
Immigrants from Africa vs Immigrants from Micronesia Associate's Degree Correlation Chart
The statistical analysis conducted on geographies consisting of 469,405,809 people shows a slight negative correlation between the proportion of Immigrants from Africa and percentage of population with at least associate's degree education in the United States with a correlation coefficient (R) of -0.098 and weighted average of 46.8%. Similarly, the statistical analysis conducted on geographies consisting of 61,609,499 people shows a weak negative correlation between the proportion of Immigrants from Micronesia and percentage of population with at least associate's degree education in the United States with a correlation coefficient (R) of -0.278 and weighted average of 40.2%, a difference of 16.5%.
Associate's Degree Correlation Summary
| Measurement | Immigrants from Africa | Immigrants from Micronesia |
| Minimum | 11.0% | 6.6% |
| Maximum | 78.0% | 52.7% |
| Range | 67.0% | 46.1% |
| Mean | 42.7% | 33.2% |
| Median | 43.2% | 34.9% |
| Interquartile 25% (IQ1) | 35.9% | 26.4% |
| Interquartile 75% (IQ3) | 49.4% | 40.6% |
| Interquartile Range (IQR) | 13.5% | 14.2% |
| Standard Deviation (Sample) | 11.2% | 11.0% |
| Standard Deviation (Population) | 11.2% | 10.9% |
Similar Demographics by Associate's Degree
Demographics Similar to Immigrants from Africa by Associate's Degree
In terms of associate's degree, the demographic groups most similar to Immigrants from Africa are Somali (46.8%, a difference of 0.060%), Colombian (46.8%, a difference of 0.060%), Scandinavian (46.9%, a difference of 0.16%), Scottish (46.9%, a difference of 0.18%), and Immigrants from South America (46.7%, a difference of 0.26%).
| Demographics | Rating | Rank | Associate's Degree |
| Kenyans | 70.6 /100 | #155 | Good 47.1% |
| South Americans | 70.5 /100 | #156 | Good 47.1% |
| Sudanese | 70.3 /100 | #157 | Good 47.1% |
| Immigrants | Germany | 69.7 /100 | #158 | Good 47.1% |
| Immigrants | Poland | 69.2 /100 | #159 | Good 47.1% |
| Scottish | 65.4 /100 | #160 | Good 46.9% |
| Scandinavians | 65.2 /100 | #161 | Good 46.9% |
| Immigrants | Africa | 63.2 /100 | #162 | Good 46.8% |
| Somalis | 62.5 /100 | #163 | Good 46.8% |
| Colombians | 62.4 /100 | #164 | Good 46.8% |
| Immigrants | South America | 59.9 /100 | #165 | Average 46.7% |
| Hungarians | 59.3 /100 | #166 | Average 46.7% |
| Immigrants | Sierra Leone | 59.2 /100 | #167 | Average 46.7% |
| Immigrants | Somalia | 55.5 /100 | #168 | Average 46.5% |
| Uruguayans | 55.4 /100 | #169 | Average 46.5% |
Demographics Similar to Immigrants from Micronesia by Associate's Degree
In terms of associate's degree, the demographic groups most similar to Immigrants from Micronesia are Immigrants from Portugal (40.1%, a difference of 0.10%), Immigrants from Nicaragua (40.3%, a difference of 0.20%), Ottawa (40.3%, a difference of 0.24%), Blackfeet (40.3%, a difference of 0.39%), and Bangladeshi (40.0%, a difference of 0.41%).
| Demographics | Rating | Rank | Associate's Degree |
| Puget Sound Salish | 0.1 /100 | #273 | Tragic 40.5% |
| Immigrants | Dominica | 0.1 /100 | #274 | Tragic 40.5% |
| Potawatomi | 0.1 /100 | #275 | Tragic 40.4% |
| Puerto Ricans | 0.1 /100 | #276 | Tragic 40.4% |
| Blackfeet | 0.1 /100 | #277 | Tragic 40.3% |
| Ottawa | 0.1 /100 | #278 | Tragic 40.3% |
| Immigrants | Nicaragua | 0.1 /100 | #279 | Tragic 40.3% |
| Immigrants | Micronesia | 0.1 /100 | #280 | Tragic 40.2% |
| Immigrants | Portugal | 0.1 /100 | #281 | Tragic 40.1% |
| Bangladeshis | 0.1 /100 | #282 | Tragic 40.0% |
| Haitians | 0.1 /100 | #283 | Tragic 40.0% |
| Comanche | 0.1 /100 | #284 | Tragic 39.9% |
| Immigrants | Belize | 0.1 /100 | #285 | Tragic 39.9% |
| Immigrants | Caribbean | 0.0 /100 | #286 | Tragic 39.7% |
| Aleuts | 0.0 /100 | #287 | Tragic 39.6% |