Immigrants from Pakistan vs Immigrants from Micronesia Associate's Degree
COMPARE
Immigrants from Pakistan
Immigrants from Micronesia
Associate's Degree
Associate's Degree Comparison
Immigrants from Pakistan
Immigrants from Micronesia
50.9%
ASSOCIATE'S DEGREE
99.5/ 100
METRIC RATING
72nd/ 347
METRIC RANK
40.2%
ASSOCIATE'S DEGREE
0.1/ 100
METRIC RATING
280th/ 347
METRIC RANK
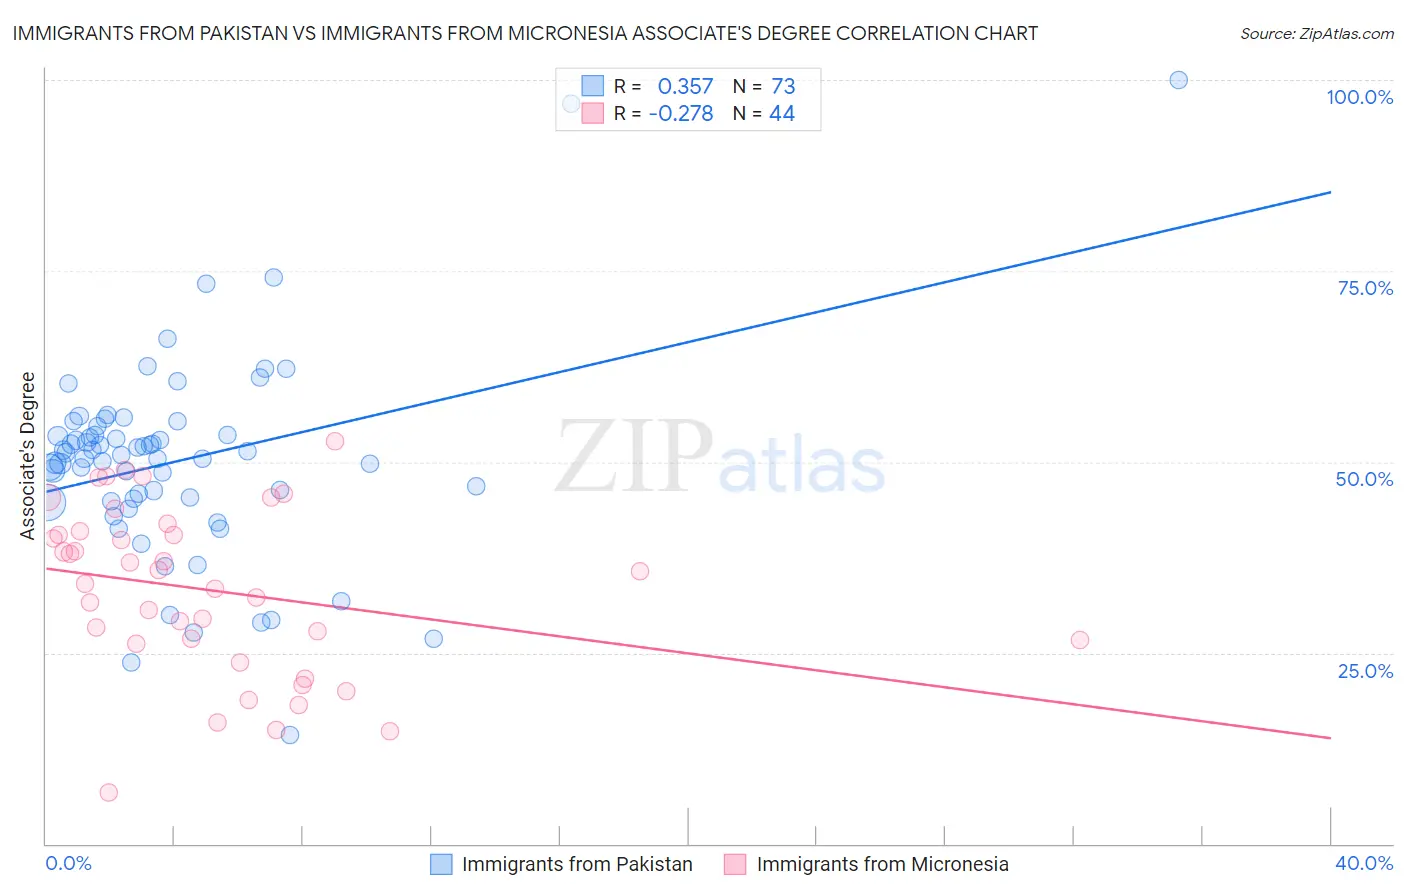
Immigrants from Pakistan vs Immigrants from Micronesia Associate's Degree Correlation Chart
The statistical analysis conducted on geographies consisting of 283,905,893 people shows a mild positive correlation between the proportion of Immigrants from Pakistan and percentage of population with at least associate's degree education in the United States with a correlation coefficient (R) of 0.357 and weighted average of 50.9%. Similarly, the statistical analysis conducted on geographies consisting of 61,609,499 people shows a weak negative correlation between the proportion of Immigrants from Micronesia and percentage of population with at least associate's degree education in the United States with a correlation coefficient (R) of -0.278 and weighted average of 40.2%, a difference of 26.6%.
Associate's Degree Correlation Summary
| Measurement | Immigrants from Pakistan | Immigrants from Micronesia |
| Minimum | 14.3% | 6.6% |
| Maximum | 100.0% | 52.7% |
| Range | 85.7% | 46.1% |
| Mean | 50.1% | 33.2% |
| Median | 50.9% | 34.9% |
| Interquartile 25% (IQ1) | 45.0% | 26.4% |
| Interquartile 75% (IQ3) | 54.1% | 40.6% |
| Interquartile Range (IQR) | 9.2% | 14.2% |
| Standard Deviation (Sample) | 13.3% | 11.0% |
| Standard Deviation (Population) | 13.2% | 10.9% |
Similar Demographics by Associate's Degree
Demographics Similar to Immigrants from Pakistan by Associate's Degree
In terms of associate's degree, the demographic groups most similar to Immigrants from Pakistan are Immigrants from Romania (50.9%, a difference of 0.060%), Immigrants from Argentina (50.9%, a difference of 0.070%), Egyptian (50.9%, a difference of 0.10%), Immigrants from Indonesia (51.0%, a difference of 0.22%), and Carpatho Rusyn (50.6%, a difference of 0.46%).
| Demographics | Rating | Rank | Associate's Degree |
| Zimbabweans | 99.7 /100 | #65 | Exceptional 51.3% |
| Immigrants | Europe | 99.7 /100 | #66 | Exceptional 51.3% |
| Argentineans | 99.6 /100 | #67 | Exceptional 51.2% |
| Immigrants | Indonesia | 99.5 /100 | #68 | Exceptional 51.0% |
| Egyptians | 99.5 /100 | #69 | Exceptional 50.9% |
| Immigrants | Argentina | 99.5 /100 | #70 | Exceptional 50.9% |
| Immigrants | Romania | 99.5 /100 | #71 | Exceptional 50.9% |
| Immigrants | Pakistan | 99.5 /100 | #72 | Exceptional 50.9% |
| Carpatho Rusyns | 99.3 /100 | #73 | Exceptional 50.6% |
| Lithuanians | 99.3 /100 | #74 | Exceptional 50.6% |
| Immigrants | Scotland | 99.3 /100 | #75 | Exceptional 50.6% |
| Immigrants | Zimbabwe | 99.2 /100 | #76 | Exceptional 50.5% |
| Immigrants | Lebanon | 99.1 /100 | #77 | Exceptional 50.5% |
| Immigrants | Eastern Europe | 99.1 /100 | #78 | Exceptional 50.5% |
| Ethiopians | 99.1 /100 | #79 | Exceptional 50.4% |
Demographics Similar to Immigrants from Micronesia by Associate's Degree
In terms of associate's degree, the demographic groups most similar to Immigrants from Micronesia are Immigrants from Portugal (40.1%, a difference of 0.10%), Immigrants from Nicaragua (40.3%, a difference of 0.20%), Ottawa (40.3%, a difference of 0.24%), Blackfeet (40.3%, a difference of 0.39%), and Bangladeshi (40.0%, a difference of 0.41%).
| Demographics | Rating | Rank | Associate's Degree |
| Puget Sound Salish | 0.1 /100 | #273 | Tragic 40.5% |
| Immigrants | Dominica | 0.1 /100 | #274 | Tragic 40.5% |
| Potawatomi | 0.1 /100 | #275 | Tragic 40.4% |
| Puerto Ricans | 0.1 /100 | #276 | Tragic 40.4% |
| Blackfeet | 0.1 /100 | #277 | Tragic 40.3% |
| Ottawa | 0.1 /100 | #278 | Tragic 40.3% |
| Immigrants | Nicaragua | 0.1 /100 | #279 | Tragic 40.3% |
| Immigrants | Micronesia | 0.1 /100 | #280 | Tragic 40.2% |
| Immigrants | Portugal | 0.1 /100 | #281 | Tragic 40.1% |
| Bangladeshis | 0.1 /100 | #282 | Tragic 40.0% |
| Haitians | 0.1 /100 | #283 | Tragic 40.0% |
| Comanche | 0.1 /100 | #284 | Tragic 39.9% |
| Immigrants | Belize | 0.1 /100 | #285 | Tragic 39.9% |
| Immigrants | Caribbean | 0.0 /100 | #286 | Tragic 39.7% |
| Aleuts | 0.0 /100 | #287 | Tragic 39.6% |