Peruvian vs Immigrants Associate's Degree
COMPARE
Peruvian
Immigrants
Associate's Degree
Associate's Degree Comparison
Peruvians
Immigrants
46.4%
ASSOCIATE'S DEGREE
50.5/ 100
METRIC RATING
172nd/ 347
METRIC RANK
44.5%
ASSOCIATE'S DEGREE
10.5/ 100
METRIC RATING
217th/ 347
METRIC RANK
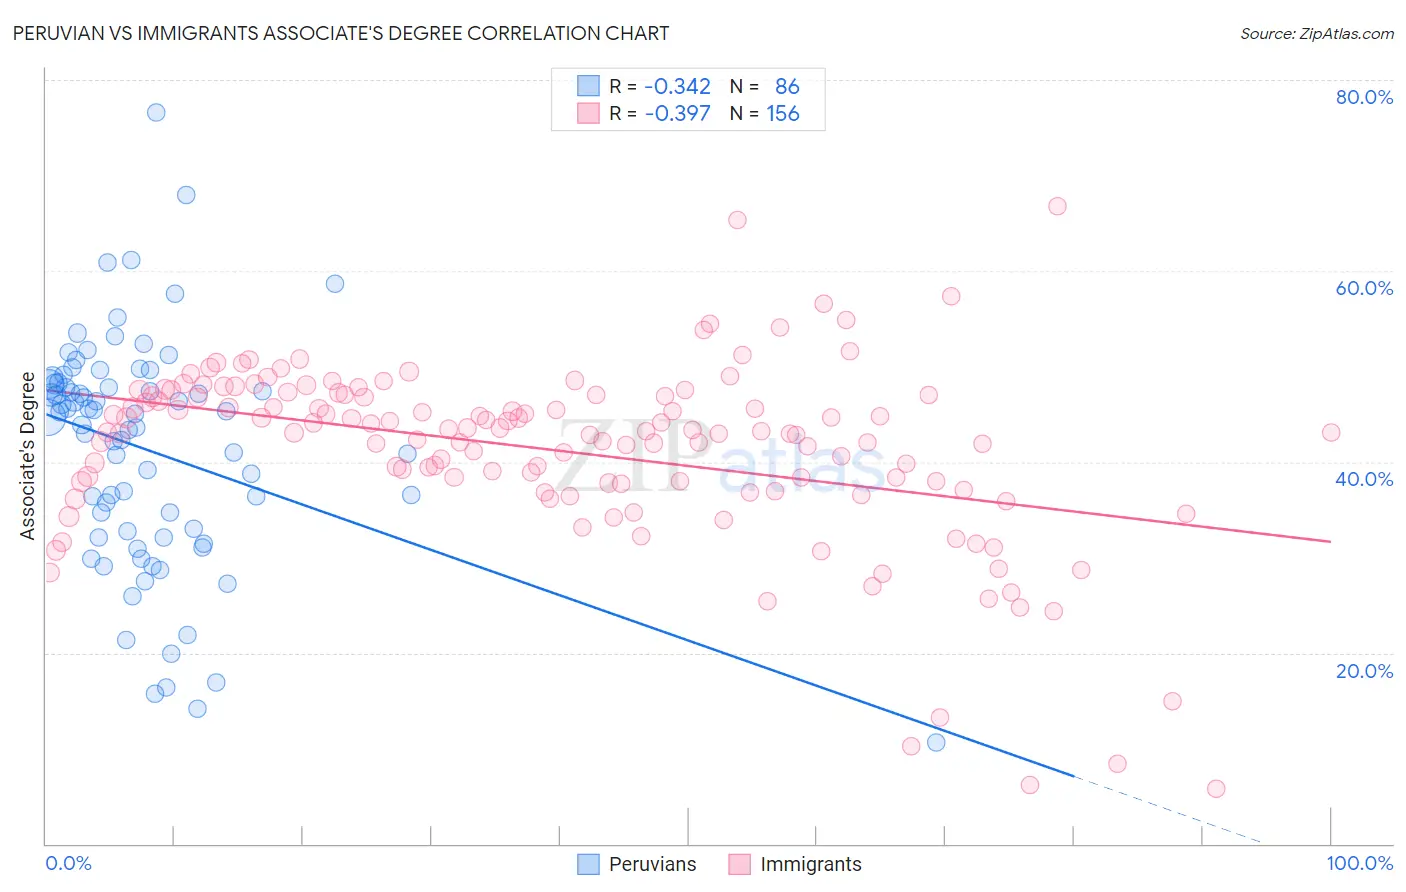
Peruvian vs Immigrants Associate's Degree Correlation Chart
The statistical analysis conducted on geographies consisting of 363,234,961 people shows a mild negative correlation between the proportion of Peruvians and percentage of population with at least associate's degree education in the United States with a correlation coefficient (R) of -0.342 and weighted average of 46.4%. Similarly, the statistical analysis conducted on geographies consisting of 577,638,441 people shows a mild negative correlation between the proportion of Immigrants and percentage of population with at least associate's degree education in the United States with a correlation coefficient (R) of -0.397 and weighted average of 44.5%, a difference of 4.2%.
Associate's Degree Correlation Summary
| Measurement | Peruvian | Immigrants |
| Minimum | 10.6% | 5.7% |
| Maximum | 76.6% | 66.8% |
| Range | 66.0% | 61.1% |
| Mean | 41.3% | 41.2% |
| Median | 44.9% | 43.1% |
| Interquartile 25% (IQ1) | 32.7% | 37.8% |
| Interquartile 75% (IQ3) | 48.1% | 46.9% |
| Interquartile Range (IQR) | 15.5% | 9.1% |
| Standard Deviation (Sample) | 12.1% | 9.6% |
| Standard Deviation (Population) | 12.0% | 9.5% |
Similar Demographics by Associate's Degree
Demographics Similar to Peruvians by Associate's Degree
In terms of associate's degree, the demographic groups most similar to Peruvians are Immigrants from Iraq (46.4%, a difference of 0.020%), English (46.4%, a difference of 0.040%), Belgian (46.3%, a difference of 0.12%), Finnish (46.3%, a difference of 0.15%), and Slovak (46.3%, a difference of 0.16%).
| Demographics | Rating | Rank | Associate's Degree |
| Immigrants | South America | 59.9 /100 | #165 | Average 46.7% |
| Hungarians | 59.3 /100 | #166 | Average 46.7% |
| Immigrants | Sierra Leone | 59.2 /100 | #167 | Average 46.7% |
| Immigrants | Somalia | 55.5 /100 | #168 | Average 46.5% |
| Uruguayans | 55.4 /100 | #169 | Average 46.5% |
| Irish | 53.6 /100 | #170 | Average 46.5% |
| Basques | 52.8 /100 | #171 | Average 46.5% |
| Peruvians | 50.5 /100 | #172 | Average 46.4% |
| Immigrants | Iraq | 50.3 /100 | #173 | Average 46.4% |
| English | 50.0 /100 | #174 | Average 46.4% |
| Belgians | 48.9 /100 | #175 | Average 46.3% |
| Finns | 48.5 /100 | #176 | Average 46.3% |
| Slovaks | 48.4 /100 | #177 | Average 46.3% |
| Immigrants | Bosnia and Herzegovina | 48.3 /100 | #178 | Average 46.3% |
| Sri Lankans | 47.6 /100 | #179 | Average 46.3% |
Demographics Similar to Immigrants by Associate's Degree
In terms of associate's degree, the demographic groups most similar to Immigrants are Immigrants from Nigeria (44.6%, a difference of 0.19%), Spanish (44.4%, a difference of 0.25%), Immigrants from Panama (44.7%, a difference of 0.37%), Immigrants from Middle Africa (44.7%, a difference of 0.42%), and Immigrants from Ghana (44.8%, a difference of 0.68%).
| Demographics | Rating | Rank | Associate's Degree |
| Immigrants | Philippines | 16.7 /100 | #210 | Poor 45.0% |
| Immigrants | Zaire | 16.6 /100 | #211 | Poor 45.0% |
| French Canadians | 15.0 /100 | #212 | Poor 44.9% |
| Immigrants | Ghana | 14.2 /100 | #213 | Poor 44.8% |
| Immigrants | Middle Africa | 12.7 /100 | #214 | Poor 44.7% |
| Immigrants | Panama | 12.4 /100 | #215 | Poor 44.7% |
| Immigrants | Nigeria | 11.4 /100 | #216 | Poor 44.6% |
| Immigrants | Immigrants | 10.5 /100 | #217 | Poor 44.5% |
| Spanish | 9.4 /100 | #218 | Tragic 44.4% |
| Whites/Caucasians | 7.5 /100 | #219 | Tragic 44.2% |
| Portuguese | 7.2 /100 | #220 | Tragic 44.1% |
| Immigrants | Western Africa | 6.6 /100 | #221 | Tragic 44.1% |
| Barbadians | 5.8 /100 | #222 | Tragic 43.9% |
| Sub-Saharan Africans | 5.5 /100 | #223 | Tragic 43.9% |
| West Indians | 5.2 /100 | #224 | Tragic 43.8% |