Peruvian vs Immigrants from Denmark Associate's Degree
COMPARE
Peruvian
Immigrants from Denmark
Associate's Degree
Associate's Degree Comparison
Peruvians
Immigrants from Denmark
46.4%
ASSOCIATE'S DEGREE
50.5/ 100
METRIC RATING
172nd/ 347
METRIC RANK
53.1%
ASSOCIATE'S DEGREE
100.0/ 100
METRIC RATING
37th/ 347
METRIC RANK
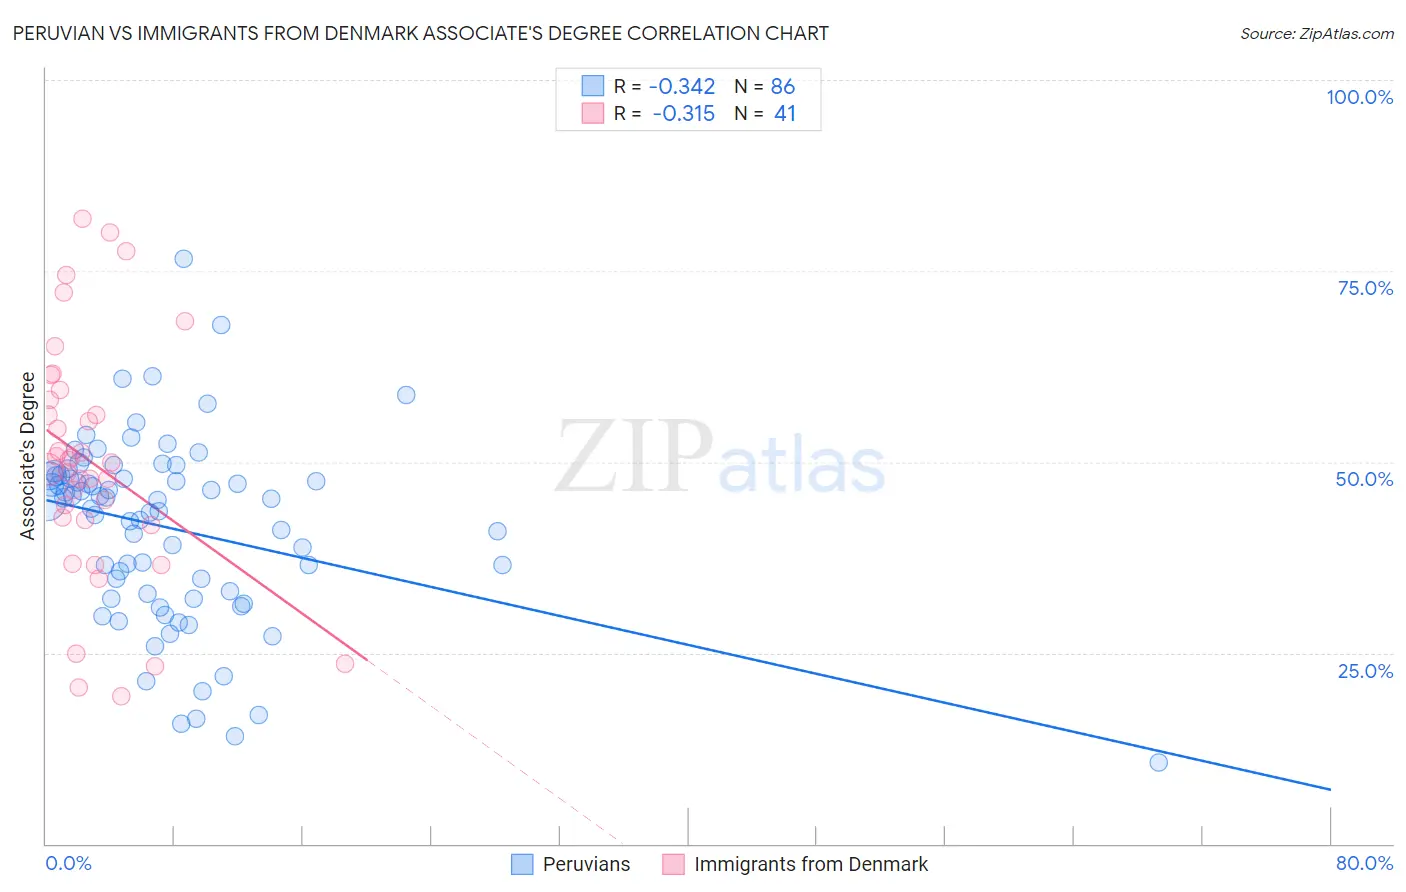
Peruvian vs Immigrants from Denmark Associate's Degree Correlation Chart
The statistical analysis conducted on geographies consisting of 363,234,961 people shows a mild negative correlation between the proportion of Peruvians and percentage of population with at least associate's degree education in the United States with a correlation coefficient (R) of -0.342 and weighted average of 46.4%. Similarly, the statistical analysis conducted on geographies consisting of 136,428,731 people shows a mild negative correlation between the proportion of Immigrants from Denmark and percentage of population with at least associate's degree education in the United States with a correlation coefficient (R) of -0.315 and weighted average of 53.1%, a difference of 14.4%.
Associate's Degree Correlation Summary
| Measurement | Peruvian | Immigrants from Denmark |
| Minimum | 10.6% | 19.3% |
| Maximum | 76.6% | 81.9% |
| Range | 66.0% | 62.5% |
| Mean | 41.3% | 49.9% |
| Median | 44.9% | 50.0% |
| Interquartile 25% (IQ1) | 32.7% | 42.1% |
| Interquartile 75% (IQ3) | 48.1% | 58.7% |
| Interquartile Range (IQR) | 15.5% | 16.6% |
| Standard Deviation (Sample) | 12.1% | 15.6% |
| Standard Deviation (Population) | 12.0% | 15.4% |
Similar Demographics by Associate's Degree
Demographics Similar to Peruvians by Associate's Degree
In terms of associate's degree, the demographic groups most similar to Peruvians are Immigrants from Iraq (46.4%, a difference of 0.020%), English (46.4%, a difference of 0.040%), Belgian (46.3%, a difference of 0.12%), Finnish (46.3%, a difference of 0.15%), and Slovak (46.3%, a difference of 0.16%).
| Demographics | Rating | Rank | Associate's Degree |
| Immigrants | South America | 59.9 /100 | #165 | Average 46.7% |
| Hungarians | 59.3 /100 | #166 | Average 46.7% |
| Immigrants | Sierra Leone | 59.2 /100 | #167 | Average 46.7% |
| Immigrants | Somalia | 55.5 /100 | #168 | Average 46.5% |
| Uruguayans | 55.4 /100 | #169 | Average 46.5% |
| Irish | 53.6 /100 | #170 | Average 46.5% |
| Basques | 52.8 /100 | #171 | Average 46.5% |
| Peruvians | 50.5 /100 | #172 | Average 46.4% |
| Immigrants | Iraq | 50.3 /100 | #173 | Average 46.4% |
| English | 50.0 /100 | #174 | Average 46.4% |
| Belgians | 48.9 /100 | #175 | Average 46.3% |
| Finns | 48.5 /100 | #176 | Average 46.3% |
| Slovaks | 48.4 /100 | #177 | Average 46.3% |
| Immigrants | Bosnia and Herzegovina | 48.3 /100 | #178 | Average 46.3% |
| Sri Lankans | 47.6 /100 | #179 | Average 46.3% |
Demographics Similar to Immigrants from Denmark by Associate's Degree
In terms of associate's degree, the demographic groups most similar to Immigrants from Denmark are Immigrants from Russia (53.1%, a difference of 0.080%), Mongolian (53.0%, a difference of 0.16%), Russian (53.2%, a difference of 0.36%), Bulgarian (53.3%, a difference of 0.43%), and Immigrants from Belarus (52.8%, a difference of 0.45%).
| Demographics | Rating | Rank | Associate's Degree |
| Immigrants | Sri Lanka | 100.0 /100 | #30 | Exceptional 53.7% |
| Immigrants | Northern Europe | 100.0 /100 | #31 | Exceptional 53.5% |
| Immigrants | Turkey | 100.0 /100 | #32 | Exceptional 53.4% |
| Israelis | 100.0 /100 | #33 | Exceptional 53.4% |
| Bulgarians | 100.0 /100 | #34 | Exceptional 53.3% |
| Russians | 100.0 /100 | #35 | Exceptional 53.2% |
| Immigrants | Russia | 100.0 /100 | #36 | Exceptional 53.1% |
| Immigrants | Denmark | 100.0 /100 | #37 | Exceptional 53.1% |
| Mongolians | 100.0 /100 | #38 | Exceptional 53.0% |
| Immigrants | Belarus | 99.9 /100 | #39 | Exceptional 52.8% |
| Immigrants | Latvia | 99.9 /100 | #40 | Exceptional 52.8% |
| Immigrants | Saudi Arabia | 99.9 /100 | #41 | Exceptional 52.6% |
| Immigrants | Malaysia | 99.9 /100 | #42 | Exceptional 52.5% |
| Immigrants | South Africa | 99.9 /100 | #43 | Exceptional 52.5% |
| Estonians | 99.9 /100 | #44 | Exceptional 52.5% |