Peruvian vs Spanish American Associate's Degree
COMPARE
Peruvian
Spanish American
Associate's Degree
Associate's Degree Comparison
Peruvians
Spanish Americans
46.4%
ASSOCIATE'S DEGREE
50.5/ 100
METRIC RATING
172nd/ 347
METRIC RANK
41.8%
ASSOCIATE'S DEGREE
0.5/ 100
METRIC RATING
257th/ 347
METRIC RANK
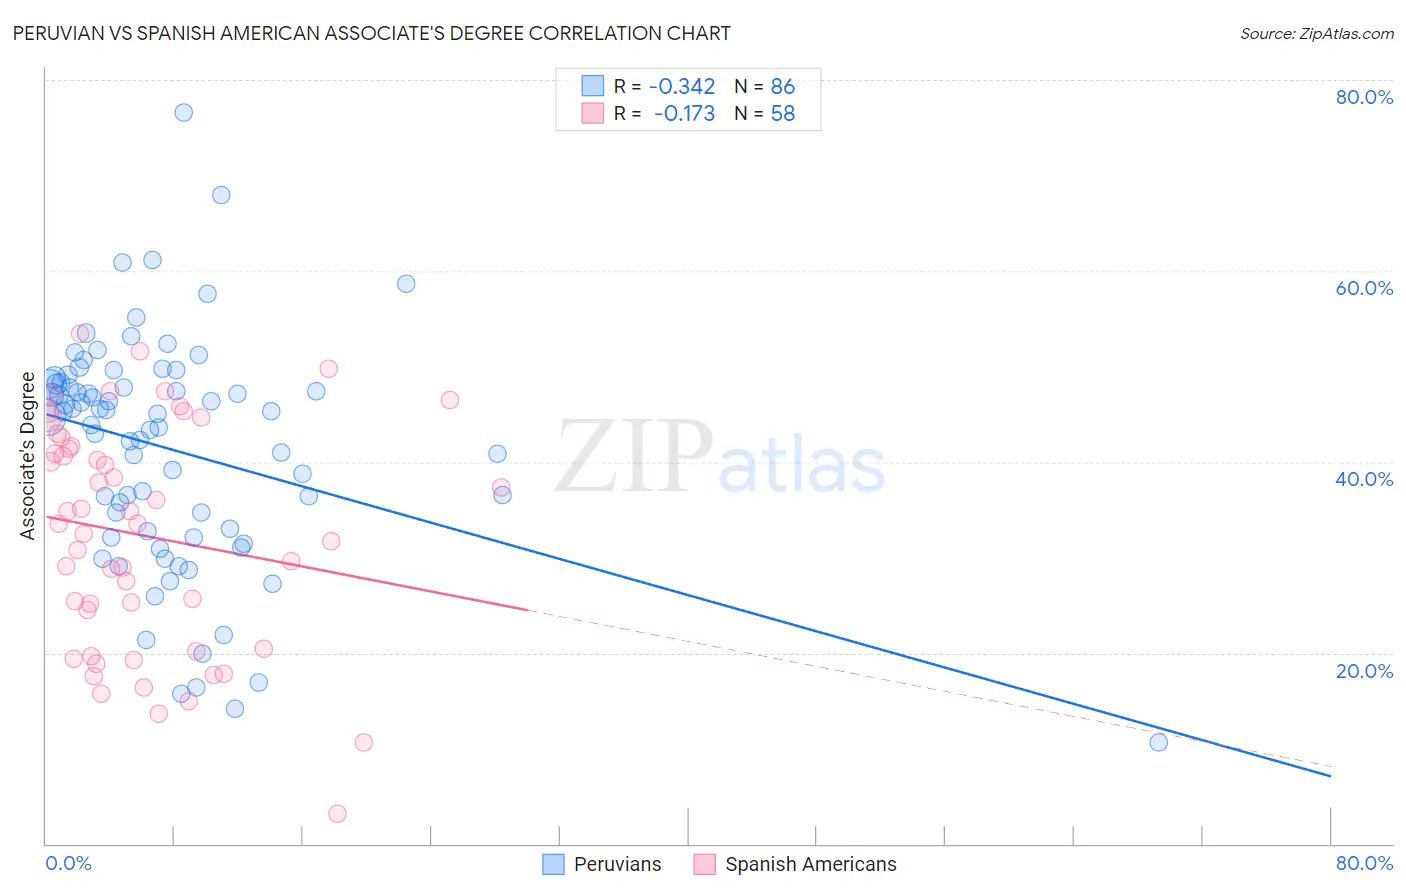
Peruvian vs Spanish American Associate's Degree Correlation Chart
The statistical analysis conducted on geographies consisting of 363,234,961 people shows a mild negative correlation between the proportion of Peruvians and percentage of population with at least associate's degree education in the United States with a correlation coefficient (R) of -0.342 and weighted average of 46.4%. Similarly, the statistical analysis conducted on geographies consisting of 103,167,704 people shows a poor negative correlation between the proportion of Spanish Americans and percentage of population with at least associate's degree education in the United States with a correlation coefficient (R) of -0.173 and weighted average of 41.8%, a difference of 11.0%.
Associate's Degree Correlation Summary
| Measurement | Peruvian | Spanish American |
| Minimum | 10.6% | 3.1% |
| Maximum | 76.6% | 53.4% |
| Range | 66.0% | 50.3% |
| Mean | 41.3% | 32.2% |
| Median | 44.9% | 33.5% |
| Interquartile 25% (IQ1) | 32.7% | 20.5% |
| Interquartile 75% (IQ3) | 48.1% | 41.7% |
| Interquartile Range (IQR) | 15.5% | 21.2% |
| Standard Deviation (Sample) | 12.1% | 11.9% |
| Standard Deviation (Population) | 12.0% | 11.8% |
Similar Demographics by Associate's Degree
Demographics Similar to Peruvians by Associate's Degree
In terms of associate's degree, the demographic groups most similar to Peruvians are Immigrants from Iraq (46.4%, a difference of 0.020%), English (46.4%, a difference of 0.040%), Belgian (46.3%, a difference of 0.12%), Finnish (46.3%, a difference of 0.15%), and Slovak (46.3%, a difference of 0.16%).
| Demographics | Rating | Rank | Associate's Degree |
| Immigrants | South America | 59.9 /100 | #165 | Average 46.7% |
| Hungarians | 59.3 /100 | #166 | Average 46.7% |
| Immigrants | Sierra Leone | 59.2 /100 | #167 | Average 46.7% |
| Immigrants | Somalia | 55.5 /100 | #168 | Average 46.5% |
| Uruguayans | 55.4 /100 | #169 | Average 46.5% |
| Irish | 53.6 /100 | #170 | Average 46.5% |
| Basques | 52.8 /100 | #171 | Average 46.5% |
| Peruvians | 50.5 /100 | #172 | Average 46.4% |
| Immigrants | Iraq | 50.3 /100 | #173 | Average 46.4% |
| English | 50.0 /100 | #174 | Average 46.4% |
| Belgians | 48.9 /100 | #175 | Average 46.3% |
| Finns | 48.5 /100 | #176 | Average 46.3% |
| Slovaks | 48.4 /100 | #177 | Average 46.3% |
| Immigrants | Bosnia and Herzegovina | 48.3 /100 | #178 | Average 46.3% |
| Sri Lankans | 47.6 /100 | #179 | Average 46.3% |
Demographics Similar to Spanish Americans by Associate's Degree
In terms of associate's degree, the demographic groups most similar to Spanish Americans are Immigrants from Congo (41.8%, a difference of 0.060%), Immigrants from Guyana (41.8%, a difference of 0.18%), Japanese (41.7%, a difference of 0.22%), Cuban (41.9%, a difference of 0.27%), and Malaysian (41.6%, a difference of 0.32%).
| Demographics | Rating | Rank | Associate's Degree |
| U.S. Virgin Islanders | 0.7 /100 | #250 | Tragic 42.1% |
| Immigrants | Bahamas | 0.7 /100 | #251 | Tragic 42.1% |
| French American Indians | 0.6 /100 | #252 | Tragic 42.0% |
| Indonesians | 0.6 /100 | #253 | Tragic 41.9% |
| Cubans | 0.6 /100 | #254 | Tragic 41.9% |
| Immigrants | Guyana | 0.5 /100 | #255 | Tragic 41.8% |
| Immigrants | Congo | 0.5 /100 | #256 | Tragic 41.8% |
| Spanish Americans | 0.5 /100 | #257 | Tragic 41.8% |
| Japanese | 0.5 /100 | #258 | Tragic 41.7% |
| Malaysians | 0.4 /100 | #259 | Tragic 41.6% |
| Marshallese | 0.4 /100 | #260 | Tragic 41.6% |
| Nicaraguans | 0.4 /100 | #261 | Tragic 41.5% |
| Bahamians | 0.4 /100 | #262 | Tragic 41.5% |
| Immigrants | Jamaica | 0.3 /100 | #263 | Tragic 41.5% |
| Osage | 0.3 /100 | #264 | Tragic 41.5% |