Peruvian vs British Householder Income Under 25 years
COMPARE
Peruvian
British
Householder Income Under 25 years
Householder Income Under 25 years Comparison
Peruvians
British
$56,052
HOUSEHOLDER INCOME UNDER 25 YEARS
100.0/ 100
METRIC RATING
32nd/ 347
METRIC RANK
$51,477
HOUSEHOLDER INCOME UNDER 25 YEARS
14.9/ 100
METRIC RATING
201st/ 347
METRIC RANK
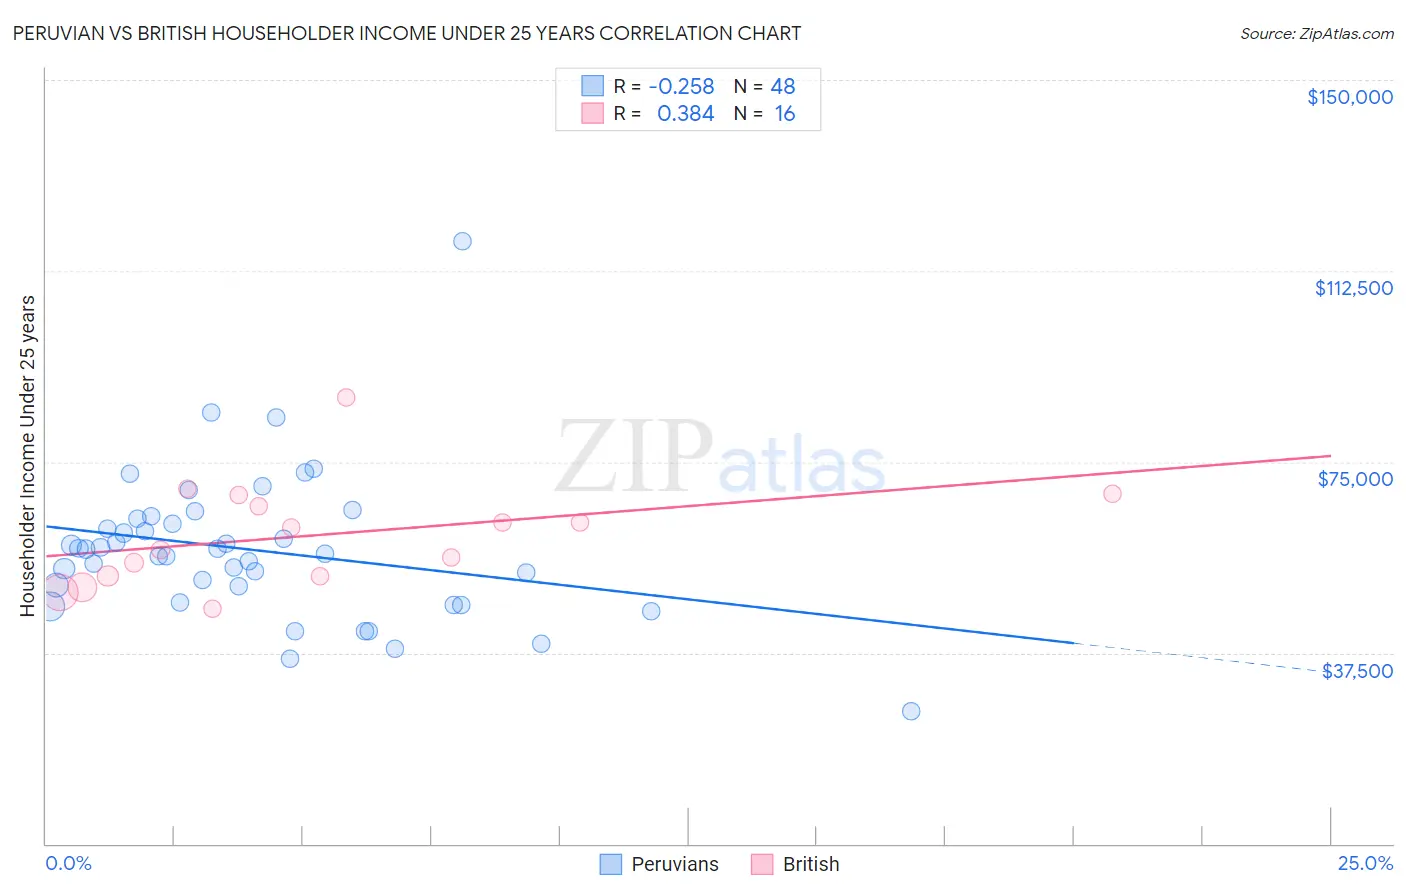
Peruvian vs British Householder Income Under 25 years Correlation Chart
The statistical analysis conducted on geographies consisting of 309,109,247 people shows a weak negative correlation between the proportion of Peruvians and household income with householder under the age of 25 in the United States with a correlation coefficient (R) of -0.258 and weighted average of $56,052. Similarly, the statistical analysis conducted on geographies consisting of 421,331,557 people shows a mild positive correlation between the proportion of British and household income with householder under the age of 25 in the United States with a correlation coefficient (R) of 0.384 and weighted average of $51,477, a difference of 8.9%.
Householder Income Under 25 years Correlation Summary
| Measurement | Peruvian | British |
| Minimum | $25,923 | $46,064 |
| Maximum | $118,438 | $87,721 |
| Range | $92,515 | $41,657 |
| Mean | $57,665 | $60,580 |
| Median | $57,415 | $59,896 |
| Interquartile 25% (IQ1) | $48,987 | $52,513 |
| Interquartile 75% (IQ3) | $63,410 | $67,314 |
| Interquartile Range (IQR) | $14,423 | $14,801 |
| Standard Deviation (Sample) | $14,693 | $10,393 |
| Standard Deviation (Population) | $14,539 | $10,063 |
Similar Demographics by Householder Income Under 25 years
Demographics Similar to Peruvians by Householder Income Under 25 years
In terms of householder income under 25 years, the demographic groups most similar to Peruvians are Vietnamese ($56,127, a difference of 0.13%), Immigrants from Moldova ($56,168, a difference of 0.21%), Inupiat ($55,935, a difference of 0.21%), Immigrants from Japan ($55,932, a difference of 0.21%), and Tlingit-Haida ($55,914, a difference of 0.25%).
| Demographics | Rating | Rank | Householder Income Under 25 years |
| Immigrants | Pakistan | 100.0 /100 | #25 | Exceptional $56,789 |
| Immigrants | Australia | 100.0 /100 | #26 | Exceptional $56,660 |
| Immigrants | North Macedonia | 100.0 /100 | #27 | Exceptional $56,503 |
| Immigrants | Peru | 100.0 /100 | #28 | Exceptional $56,384 |
| Immigrants | Asia | 100.0 /100 | #29 | Exceptional $56,379 |
| Immigrants | Moldova | 100.0 /100 | #30 | Exceptional $56,168 |
| Vietnamese | 100.0 /100 | #31 | Exceptional $56,127 |
| Peruvians | 100.0 /100 | #32 | Exceptional $56,052 |
| Inupiat | 100.0 /100 | #33 | Exceptional $55,935 |
| Immigrants | Japan | 100.0 /100 | #34 | Exceptional $55,932 |
| Tlingit-Haida | 100.0 /100 | #35 | Exceptional $55,914 |
| Immigrants | Israel | 100.0 /100 | #36 | Exceptional $55,913 |
| Immigrants | Russia | 100.0 /100 | #37 | Exceptional $55,891 |
| Immigrants | Iran | 100.0 /100 | #38 | Exceptional $55,880 |
| Immigrants | Belarus | 100.0 /100 | #39 | Exceptional $55,743 |
Demographics Similar to British by Householder Income Under 25 years
In terms of householder income under 25 years, the demographic groups most similar to British are Immigrants from West Indies ($51,479, a difference of 0.0%), Immigrants from Syria ($51,494, a difference of 0.030%), Swiss ($51,493, a difference of 0.030%), Pima ($51,503, a difference of 0.050%), and Immigrants from Guatemala ($51,447, a difference of 0.060%).
| Demographics | Rating | Rank | Householder Income Under 25 years |
| Guatemalans | 16.4 /100 | #194 | Poor $51,525 |
| Estonians | 16.4 /100 | #195 | Poor $51,523 |
| Palestinians | 16.1 /100 | #196 | Poor $51,515 |
| Pima | 15.7 /100 | #197 | Poor $51,503 |
| Immigrants | Syria | 15.4 /100 | #198 | Poor $51,494 |
| Swiss | 15.4 /100 | #199 | Poor $51,493 |
| Immigrants | West Indies | 14.9 /100 | #200 | Poor $51,479 |
| British | 14.9 /100 | #201 | Poor $51,477 |
| Immigrants | Guatemala | 14.0 /100 | #202 | Poor $51,447 |
| Immigrants | Cameroon | 13.6 /100 | #203 | Poor $51,433 |
| Czechs | 13.2 /100 | #204 | Poor $51,421 |
| Cape Verdeans | 12.3 /100 | #205 | Poor $51,387 |
| Immigrants | Latin America | 12.3 /100 | #206 | Poor $51,387 |
| South Africans | 12.2 /100 | #207 | Poor $51,383 |
| Immigrants | Jordan | 11.9 /100 | #208 | Poor $51,370 |