Peruvian vs Immigrants from Peru College, 1 year or more
COMPARE
Peruvian
Immigrants from Peru
College, 1 year or more
College, 1 year or more Comparison
Peruvians
Immigrants from Peru
58.6%
COLLEGE, 1 YEAR OR MORE
27.5/ 100
METRIC RATING
193rd/ 347
METRIC RANK
57.7%
COLLEGE, 1 YEAR OR MORE
10.6/ 100
METRIC RATING
216th/ 347
METRIC RANK
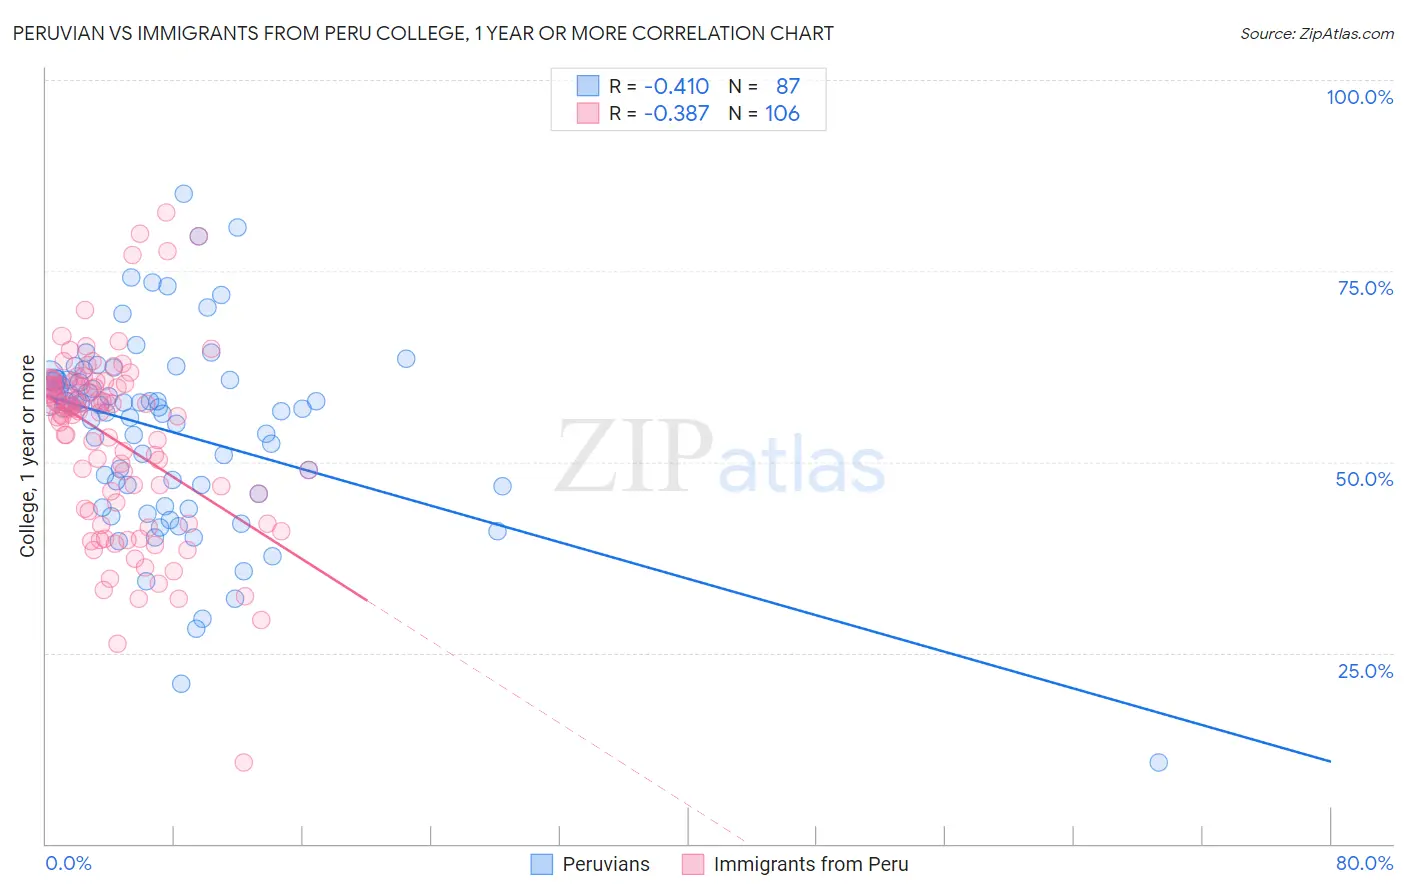
Peruvian vs Immigrants from Peru College, 1 year or more Correlation Chart
The statistical analysis conducted on geographies consisting of 363,249,143 people shows a moderate negative correlation between the proportion of Peruvians and percentage of population with at least college, 1 year or more education in the United States with a correlation coefficient (R) of -0.410 and weighted average of 58.6%. Similarly, the statistical analysis conducted on geographies consisting of 328,860,288 people shows a mild negative correlation between the proportion of Immigrants from Peru and percentage of population with at least college, 1 year or more education in the United States with a correlation coefficient (R) of -0.387 and weighted average of 57.7%, a difference of 1.6%.
College, 1 year or more Correlation Summary
| Measurement | Peruvian | Immigrants from Peru |
| Minimum | 10.6% | 10.6% |
| Maximum | 85.1% | 82.6% |
| Range | 74.5% | 72.0% |
| Mean | 53.9% | 52.8% |
| Median | 57.1% | 56.3% |
| Interquartile 25% (IQ1) | 45.8% | 43.5% |
| Interquartile 75% (IQ3) | 60.7% | 60.2% |
| Interquartile Range (IQR) | 14.9% | 16.7% |
| Standard Deviation (Sample) | 12.7% | 12.2% |
| Standard Deviation (Population) | 12.6% | 12.1% |
Similar Demographics by College, 1 year or more
Demographics Similar to Peruvians by College, 1 year or more
In terms of college, 1 year or more, the demographic groups most similar to Peruvians are Colombian (58.7%, a difference of 0.010%), Costa Rican (58.6%, a difference of 0.070%), Dutch (58.6%, a difference of 0.090%), Guamanian/Chamorro (58.6%, a difference of 0.090%), and Immigrants from Thailand (58.6%, a difference of 0.10%).
| Demographics | Rating | Rank | College, 1 year or more |
| Scotch-Irish | 34.7 /100 | #186 | Fair 58.9% |
| Germans | 34.7 /100 | #187 | Fair 58.9% |
| French | 34.4 /100 | #188 | Fair 58.9% |
| Uruguayans | 31.8 /100 | #189 | Fair 58.8% |
| Immigrants | Cameroon | 31.2 /100 | #190 | Fair 58.8% |
| Immigrants | Philippines | 29.2 /100 | #191 | Fair 58.7% |
| Colombians | 27.6 /100 | #192 | Fair 58.7% |
| Peruvians | 27.5 /100 | #193 | Fair 58.6% |
| Costa Ricans | 26.4 /100 | #194 | Fair 58.6% |
| Dutch | 26.2 /100 | #195 | Fair 58.6% |
| Guamanians/Chamorros | 26.2 /100 | #196 | Fair 58.6% |
| Immigrants | Thailand | 26.0 /100 | #197 | Fair 58.6% |
| Immigrants | South Eastern Asia | 25.1 /100 | #198 | Fair 58.5% |
| Slovaks | 24.6 /100 | #199 | Fair 58.5% |
| Spanish | 24.2 /100 | #200 | Fair 58.5% |
Demographics Similar to Immigrants from Peru by College, 1 year or more
In terms of college, 1 year or more, the demographic groups most similar to Immigrants from Peru are Tongan (57.8%, a difference of 0.13%), Immigrants from Colombia (57.8%, a difference of 0.14%), Immigrants from Senegal (57.8%, a difference of 0.17%), French Canadian (57.8%, a difference of 0.17%), and Immigrants from Panama (57.6%, a difference of 0.24%).
| Demographics | Rating | Rank | College, 1 year or more |
| Immigrants | Middle Africa | 14.0 /100 | #209 | Poor 58.0% |
| Tsimshian | 13.5 /100 | #210 | Poor 57.9% |
| Immigrants | Nigeria | 13.3 /100 | #211 | Poor 57.9% |
| Immigrants | Senegal | 11.8 /100 | #212 | Poor 57.8% |
| French Canadians | 11.8 /100 | #213 | Poor 57.8% |
| Immigrants | Colombia | 11.6 /100 | #214 | Poor 57.8% |
| Tongans | 11.6 /100 | #215 | Poor 57.8% |
| Immigrants | Peru | 10.6 /100 | #216 | Poor 57.7% |
| Immigrants | Panama | 9.1 /100 | #217 | Tragic 57.6% |
| Native Hawaiians | 9.0 /100 | #218 | Tragic 57.6% |
| Whites/Caucasians | 8.7 /100 | #219 | Tragic 57.6% |
| Immigrants | Costa Rica | 8.0 /100 | #220 | Tragic 57.5% |
| Immigrants | Ghana | 7.7 /100 | #221 | Tragic 57.4% |
| Sub-Saharan Africans | 6.1 /100 | #222 | Tragic 57.3% |
| Portuguese | 5.4 /100 | #223 | Tragic 57.2% |