Peruvian vs Immigrants from Nicaragua College, 1 year or more
COMPARE
Peruvian
Immigrants from Nicaragua
College, 1 year or more
College, 1 year or more Comparison
Peruvians
Immigrants from Nicaragua
58.6%
COLLEGE, 1 YEAR OR MORE
27.5/ 100
METRIC RATING
193rd/ 347
METRIC RANK
52.4%
COLLEGE, 1 YEAR OR MORE
0.0/ 100
METRIC RATING
299th/ 347
METRIC RANK
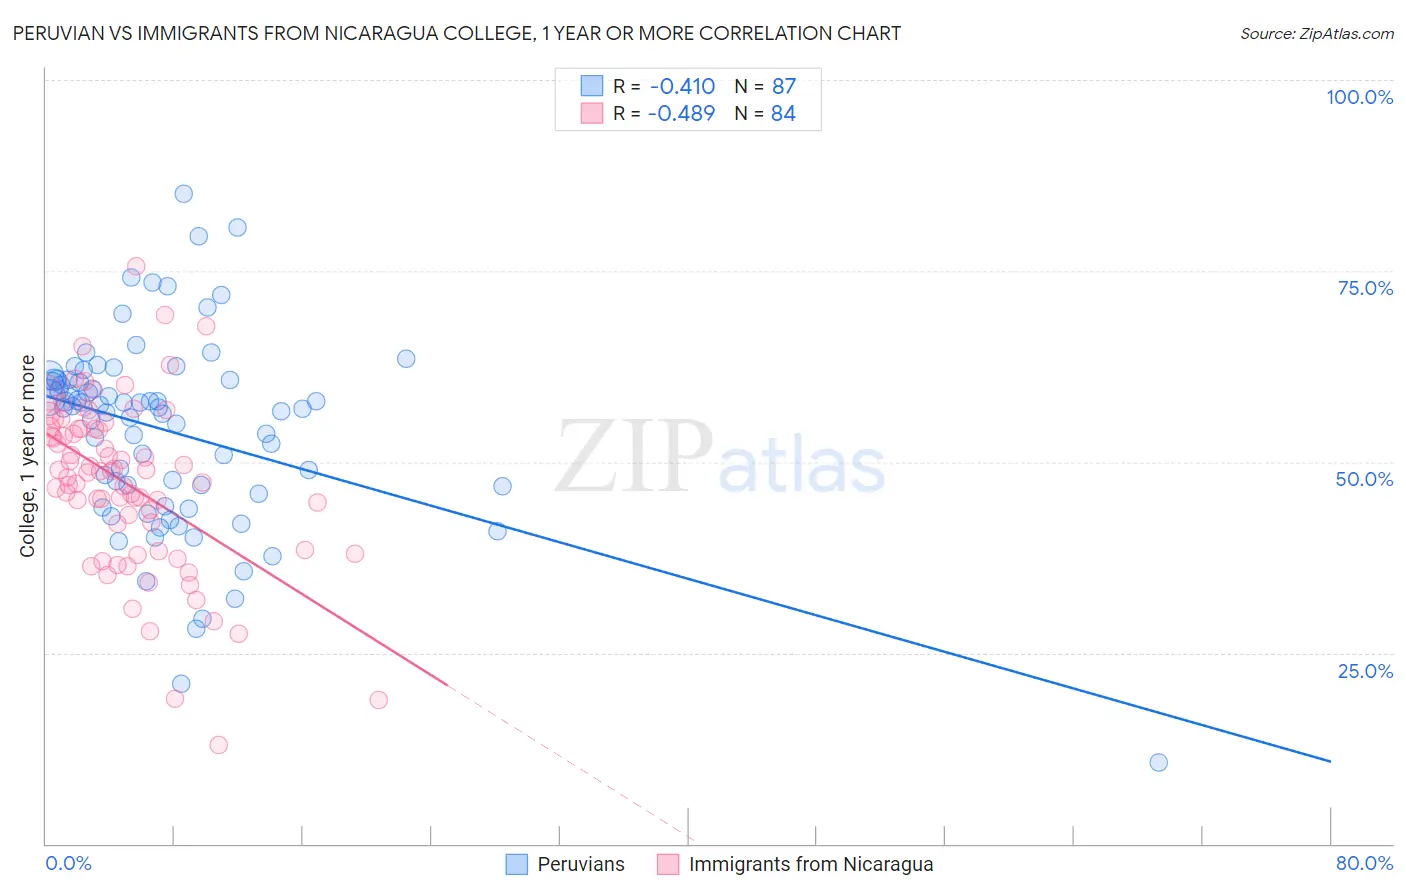
Peruvian vs Immigrants from Nicaragua College, 1 year or more Correlation Chart
The statistical analysis conducted on geographies consisting of 363,249,143 people shows a moderate negative correlation between the proportion of Peruvians and percentage of population with at least college, 1 year or more education in the United States with a correlation coefficient (R) of -0.410 and weighted average of 58.6%. Similarly, the statistical analysis conducted on geographies consisting of 236,341,850 people shows a moderate negative correlation between the proportion of Immigrants from Nicaragua and percentage of population with at least college, 1 year or more education in the United States with a correlation coefficient (R) of -0.489 and weighted average of 52.4%, a difference of 12.0%.
College, 1 year or more Correlation Summary
| Measurement | Peruvian | Immigrants from Nicaragua |
| Minimum | 10.6% | 13.0% |
| Maximum | 85.1% | 75.6% |
| Range | 74.5% | 62.6% |
| Mean | 53.9% | 47.2% |
| Median | 57.1% | 48.6% |
| Interquartile 25% (IQ1) | 45.8% | 40.2% |
| Interquartile 75% (IQ3) | 60.7% | 54.4% |
| Interquartile Range (IQR) | 14.9% | 14.2% |
| Standard Deviation (Sample) | 12.7% | 11.2% |
| Standard Deviation (Population) | 12.6% | 11.1% |
Similar Demographics by College, 1 year or more
Demographics Similar to Peruvians by College, 1 year or more
In terms of college, 1 year or more, the demographic groups most similar to Peruvians are Colombian (58.7%, a difference of 0.010%), Costa Rican (58.6%, a difference of 0.070%), Dutch (58.6%, a difference of 0.090%), Guamanian/Chamorro (58.6%, a difference of 0.090%), and Immigrants from Thailand (58.6%, a difference of 0.10%).
| Demographics | Rating | Rank | College, 1 year or more |
| Scotch-Irish | 34.7 /100 | #186 | Fair 58.9% |
| Germans | 34.7 /100 | #187 | Fair 58.9% |
| French | 34.4 /100 | #188 | Fair 58.9% |
| Uruguayans | 31.8 /100 | #189 | Fair 58.8% |
| Immigrants | Cameroon | 31.2 /100 | #190 | Fair 58.8% |
| Immigrants | Philippines | 29.2 /100 | #191 | Fair 58.7% |
| Colombians | 27.6 /100 | #192 | Fair 58.7% |
| Peruvians | 27.5 /100 | #193 | Fair 58.6% |
| Costa Ricans | 26.4 /100 | #194 | Fair 58.6% |
| Dutch | 26.2 /100 | #195 | Fair 58.6% |
| Guamanians/Chamorros | 26.2 /100 | #196 | Fair 58.6% |
| Immigrants | Thailand | 26.0 /100 | #197 | Fair 58.6% |
| Immigrants | South Eastern Asia | 25.1 /100 | #198 | Fair 58.5% |
| Slovaks | 24.6 /100 | #199 | Fair 58.5% |
| Spanish | 24.2 /100 | #200 | Fair 58.5% |
Demographics Similar to Immigrants from Nicaragua by College, 1 year or more
In terms of college, 1 year or more, the demographic groups most similar to Immigrants from Nicaragua are Choctaw (52.3%, a difference of 0.040%), Haitian (52.3%, a difference of 0.10%), Puerto Rican (52.2%, a difference of 0.23%), Creek (52.2%, a difference of 0.30%), and Immigrants from Dominica (52.5%, a difference of 0.34%).
| Demographics | Rating | Rank | College, 1 year or more |
| Chickasaw | 0.0 /100 | #292 | Tragic 53.3% |
| Blacks/African Americans | 0.0 /100 | #293 | Tragic 53.3% |
| Cherokee | 0.0 /100 | #294 | Tragic 53.2% |
| Yaqui | 0.0 /100 | #295 | Tragic 53.2% |
| Sioux | 0.0 /100 | #296 | Tragic 53.0% |
| Paiute | 0.0 /100 | #297 | Tragic 52.9% |
| Immigrants | Dominica | 0.0 /100 | #298 | Tragic 52.5% |
| Immigrants | Nicaragua | 0.0 /100 | #299 | Tragic 52.4% |
| Choctaw | 0.0 /100 | #300 | Tragic 52.3% |
| Haitians | 0.0 /100 | #301 | Tragic 52.3% |
| Puerto Ricans | 0.0 /100 | #302 | Tragic 52.2% |
| Creek | 0.0 /100 | #303 | Tragic 52.2% |
| Central Americans | 0.0 /100 | #304 | Tragic 52.1% |
| Seminole | 0.0 /100 | #305 | Tragic 52.1% |
| Mexican American Indians | 0.0 /100 | #306 | Tragic 51.9% |