Paraguayan vs Soviet Union 8th Grade
COMPARE
Paraguayan
Soviet Union
8th Grade
8th Grade Comparison
Paraguayans
Soviet Union
95.5%
8TH GRADE
22.6/ 100
METRIC RATING
198th/ 347
METRIC RANK
96.1%
8TH GRADE
92.6/ 100
METRIC RATING
130th/ 347
METRIC RANK
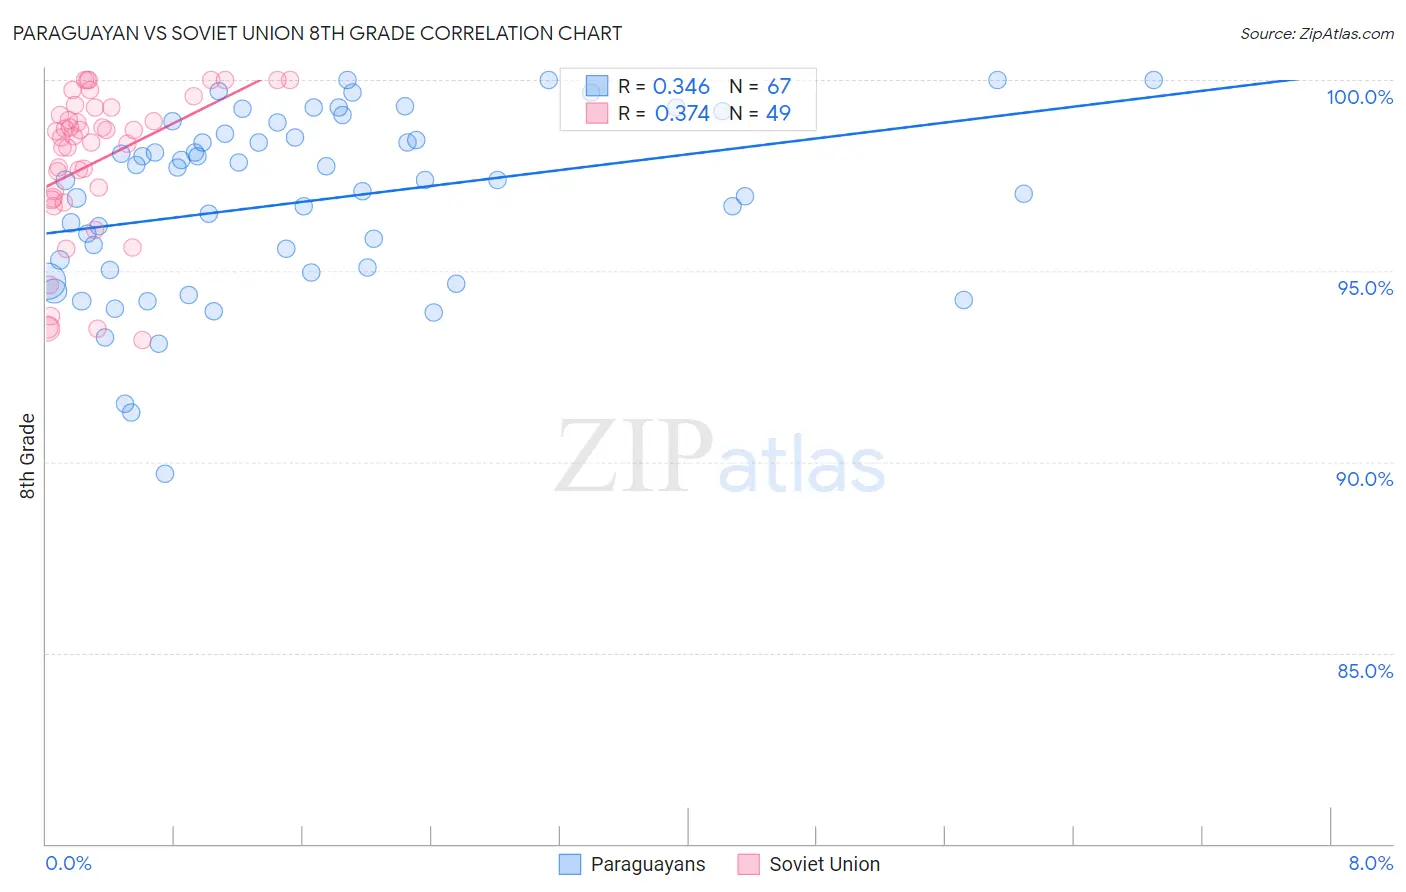
Paraguayan vs Soviet Union 8th Grade Correlation Chart
The statistical analysis conducted on geographies consisting of 95,113,577 people shows a mild positive correlation between the proportion of Paraguayans and percentage of population with at least 8th grade education in the United States with a correlation coefficient (R) of 0.346 and weighted average of 95.5%. Similarly, the statistical analysis conducted on geographies consisting of 43,454,395 people shows a mild positive correlation between the proportion of Soviet Union and percentage of population with at least 8th grade education in the United States with a correlation coefficient (R) of 0.374 and weighted average of 96.1%, a difference of 0.61%.
8th Grade Correlation Summary
| Measurement | Paraguayan | Soviet Union |
| Minimum | 89.7% | 93.2% |
| Maximum | 100.0% | 100.0% |
| Range | 10.3% | 6.8% |
| Mean | 96.8% | 97.9% |
| Median | 97.4% | 98.5% |
| Interquartile 25% (IQ1) | 95.0% | 96.9% |
| Interquartile 75% (IQ3) | 98.6% | 99.3% |
| Interquartile Range (IQR) | 3.6% | 2.4% |
| Standard Deviation (Sample) | 2.3% | 2.0% |
| Standard Deviation (Population) | 2.3% | 1.9% |
Similar Demographics by 8th Grade
Demographics Similar to Paraguayans by 8th Grade
In terms of 8th grade, the demographic groups most similar to Paraguayans are Immigrants from Northern Africa (95.5%, a difference of 0.0%), Argentinean (95.5%, a difference of 0.0%), Immigrants from Zaire (95.6%, a difference of 0.020%), Assyrian/Chaldean/Syriac (95.6%, a difference of 0.020%), and Sierra Leonean (95.6%, a difference of 0.020%).
| Demographics | Rating | Rank | 8th Grade |
| Immigrants | Nepal | 30.2 /100 | #191 | Fair 95.6% |
| Pima | 28.6 /100 | #192 | Fair 95.6% |
| Panamanians | 28.4 /100 | #193 | Fair 95.6% |
| Guamanians/Chamorros | 26.6 /100 | #194 | Fair 95.6% |
| Immigrants | Zaire | 25.2 /100 | #195 | Fair 95.6% |
| Assyrians/Chaldeans/Syriacs | 24.5 /100 | #196 | Fair 95.6% |
| Sierra Leoneans | 24.3 /100 | #197 | Fair 95.6% |
| Paraguayans | 22.6 /100 | #198 | Fair 95.5% |
| Immigrants | Northern Africa | 22.5 /100 | #199 | Fair 95.5% |
| Argentineans | 22.2 /100 | #200 | Fair 95.5% |
| Immigrants | Argentina | 20.6 /100 | #201 | Fair 95.5% |
| Apache | 19.4 /100 | #202 | Poor 95.5% |
| Moroccans | 17.4 /100 | #203 | Poor 95.5% |
| Hawaiians | 16.7 /100 | #204 | Poor 95.5% |
| Immigrants | Bahamas | 16.7 /100 | #205 | Poor 95.5% |
Demographics Similar to Soviet Union by 8th Grade
In terms of 8th grade, the demographic groups most similar to Soviet Union are Pueblo (96.1%, a difference of 0.010%), Immigrants from Kuwait (96.1%, a difference of 0.010%), Cheyenne (96.1%, a difference of 0.020%), Immigrants from Turkey (96.1%, a difference of 0.020%), and Immigrants from Hungary (96.1%, a difference of 0.020%).
| Demographics | Rating | Rank | 8th Grade |
| Filipinos | 94.6 /100 | #123 | Exceptional 96.2% |
| Palestinians | 94.6 /100 | #124 | Exceptional 96.2% |
| Immigrants | Romania | 94.1 /100 | #125 | Exceptional 96.2% |
| Choctaw | 94.0 /100 | #126 | Exceptional 96.2% |
| Immigrants | Serbia | 94.0 /100 | #127 | Exceptional 96.2% |
| Immigrants | Bosnia and Herzegovina | 93.9 /100 | #128 | Exceptional 96.2% |
| Cheyenne | 93.3 /100 | #129 | Exceptional 96.1% |
| Soviet Union | 92.6 /100 | #130 | Exceptional 96.1% |
| Pueblo | 92.3 /100 | #131 | Exceptional 96.1% |
| Immigrants | Kuwait | 92.2 /100 | #132 | Exceptional 96.1% |
| Immigrants | Turkey | 91.7 /100 | #133 | Exceptional 96.1% |
| Immigrants | Hungary | 91.5 /100 | #134 | Exceptional 96.1% |
| Basques | 91.5 /100 | #135 | Exceptional 96.1% |
| Jordanians | 91.3 /100 | #136 | Exceptional 96.1% |
| Cambodians | 90.6 /100 | #137 | Exceptional 96.1% |