Immigrants from Afghanistan vs Tsimshian 8th Grade
COMPARE
Immigrants from Afghanistan
Tsimshian
8th Grade
8th Grade Comparison
Immigrants from Afghanistan
Tsimshian
94.8%
8TH GRADE
0.2/ 100
METRIC RATING
271st/ 347
METRIC RANK
99.0%
8TH GRADE
100.0/ 100
METRIC RATING
2nd/ 347
METRIC RANK
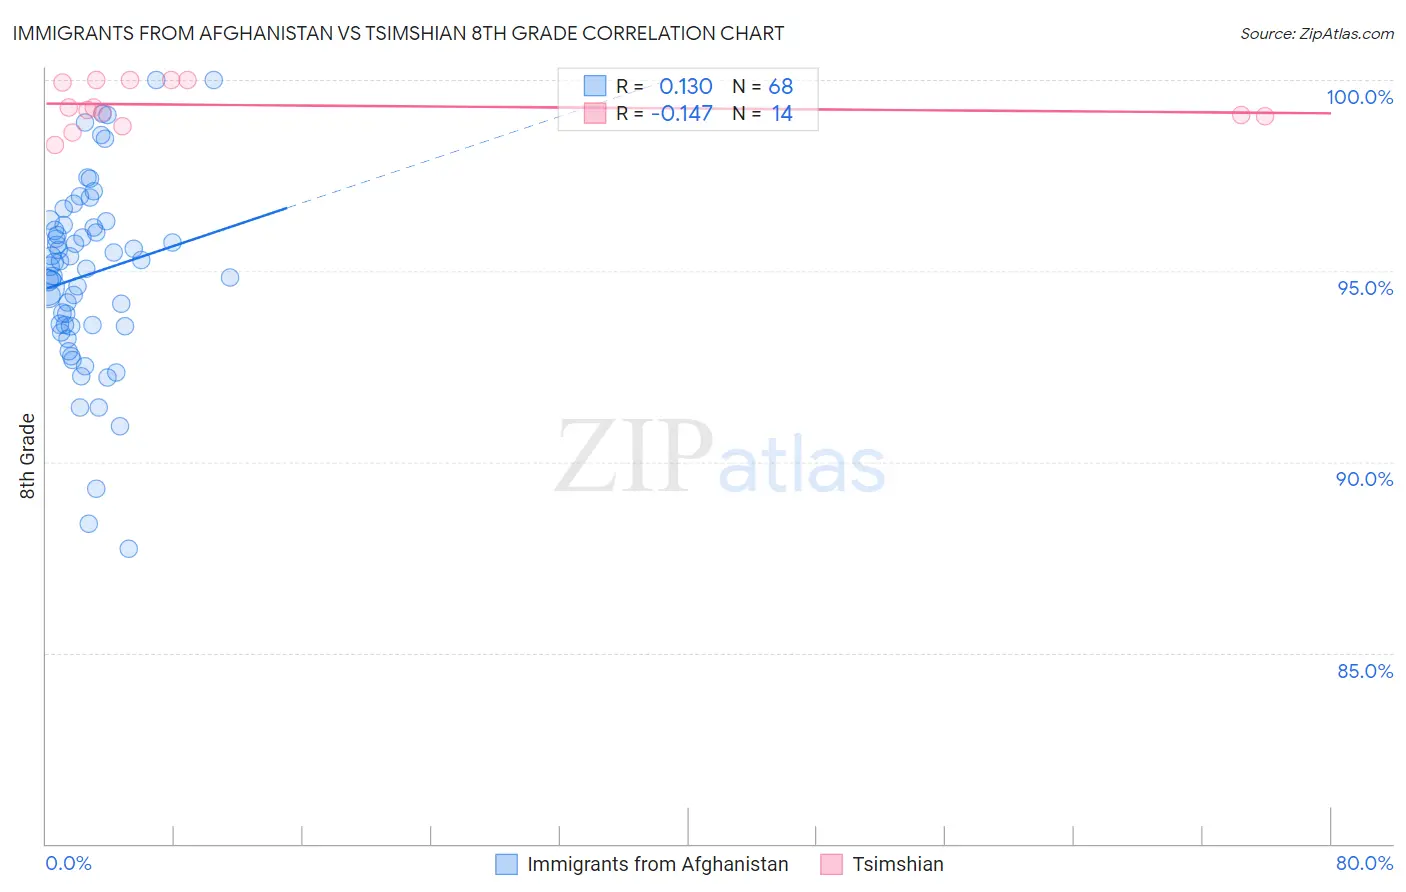
Immigrants from Afghanistan vs Tsimshian 8th Grade Correlation Chart
The statistical analysis conducted on geographies consisting of 147,629,924 people shows a poor positive correlation between the proportion of Immigrants from Afghanistan and percentage of population with at least 8th grade education in the United States with a correlation coefficient (R) of 0.130 and weighted average of 94.8%. Similarly, the statistical analysis conducted on geographies consisting of 221,806 people shows a poor negative correlation between the proportion of Tsimshian and percentage of population with at least 8th grade education in the United States with a correlation coefficient (R) of -0.147 and weighted average of 99.0%, a difference of 4.4%.
8th Grade Correlation Summary
| Measurement | Immigrants from Afghanistan | Tsimshian |
| Minimum | 87.7% | 98.3% |
| Maximum | 100.0% | 100.0% |
| Range | 12.3% | 1.7% |
| Mean | 94.9% | 99.3% |
| Median | 95.2% | 99.2% |
| Interquartile 25% (IQ1) | 93.6% | 99.1% |
| Interquartile 75% (IQ3) | 96.2% | 100.0% |
| Interquartile Range (IQR) | 2.6% | 0.93% |
| Standard Deviation (Sample) | 2.4% | 0.57% |
| Standard Deviation (Population) | 2.4% | 0.55% |
Similar Demographics by 8th Grade
Demographics Similar to Immigrants from Afghanistan by 8th Grade
In terms of 8th grade, the demographic groups most similar to Immigrants from Afghanistan are Immigrants from Uzbekistan (94.8%, a difference of 0.010%), Immigrants from South America (94.8%, a difference of 0.010%), Immigrants from Western Africa (94.8%, a difference of 0.010%), Immigrants from Thailand (94.8%, a difference of 0.020%), and Trinidadian and Tobagonian (94.7%, a difference of 0.030%).
| Demographics | Rating | Rank | 8th Grade |
| South Americans | 0.4 /100 | #264 | Tragic 94.9% |
| Yuman | 0.4 /100 | #265 | Tragic 94.9% |
| West Indians | 0.3 /100 | #266 | Tragic 94.8% |
| Immigrants | Ghana | 0.3 /100 | #267 | Tragic 94.8% |
| Immigrants | Uruguay | 0.3 /100 | #268 | Tragic 94.8% |
| Immigrants | Thailand | 0.2 /100 | #269 | Tragic 94.8% |
| Immigrants | Uzbekistan | 0.2 /100 | #270 | Tragic 94.8% |
| Immigrants | Afghanistan | 0.2 /100 | #271 | Tragic 94.8% |
| Immigrants | South America | 0.2 /100 | #272 | Tragic 94.8% |
| Immigrants | Western Africa | 0.2 /100 | #273 | Tragic 94.8% |
| Trinidadians and Tobagonians | 0.2 /100 | #274 | Tragic 94.7% |
| Immigrants | Colombia | 0.2 /100 | #275 | Tragic 94.7% |
| Peruvians | 0.1 /100 | #276 | Tragic 94.7% |
| Taiwanese | 0.1 /100 | #277 | Tragic 94.7% |
| Armenians | 0.1 /100 | #278 | Tragic 94.7% |
Demographics Similar to Tsimshian by 8th Grade
In terms of 8th grade, the demographic groups most similar to Tsimshian are Crow (99.0%, a difference of 0.090%), Finnish (98.4%, a difference of 0.60%), Carpatho Rusyn (98.1%, a difference of 0.83%), Ottawa (97.9%, a difference of 1.0%), and Dutch (97.7%, a difference of 1.3%).
| Demographics | Rating | Rank | 8th Grade |
| Crow | 100.0 /100 | #1 | Exceptional 99.0% |
| Tsimshian | 100.0 /100 | #2 | Exceptional 99.0% |
| Finns | 100.0 /100 | #3 | Exceptional 98.4% |
| Carpatho Rusyns | 100.0 /100 | #4 | Exceptional 98.1% |
| Ottawa | 100.0 /100 | #5 | Exceptional 97.9% |
| Dutch | 100.0 /100 | #6 | Exceptional 97.7% |
| Norwegians | 100.0 /100 | #7 | Exceptional 97.6% |
| Slovaks | 100.0 /100 | #8 | Exceptional 97.6% |
| Germans | 100.0 /100 | #9 | Exceptional 97.5% |
| Slovenes | 100.0 /100 | #10 | Exceptional 97.5% |
| Poles | 100.0 /100 | #11 | Exceptional 97.4% |
| Swedes | 100.0 /100 | #12 | Exceptional 97.4% |
| Alaskan Athabascans | 100.0 /100 | #13 | Exceptional 97.3% |
| English | 100.0 /100 | #14 | Exceptional 97.3% |
| Pennsylvania Germans | 100.0 /100 | #15 | Exceptional 97.3% |