Macedonian vs Tsimshian 8th Grade
COMPARE
Macedonian
Tsimshian
8th Grade
8th Grade Comparison
Macedonians
Tsimshian
96.7%
8TH GRADE
99.8/ 100
METRIC RATING
57th/ 347
METRIC RANK
99.0%
8TH GRADE
100.0/ 100
METRIC RATING
2nd/ 347
METRIC RANK
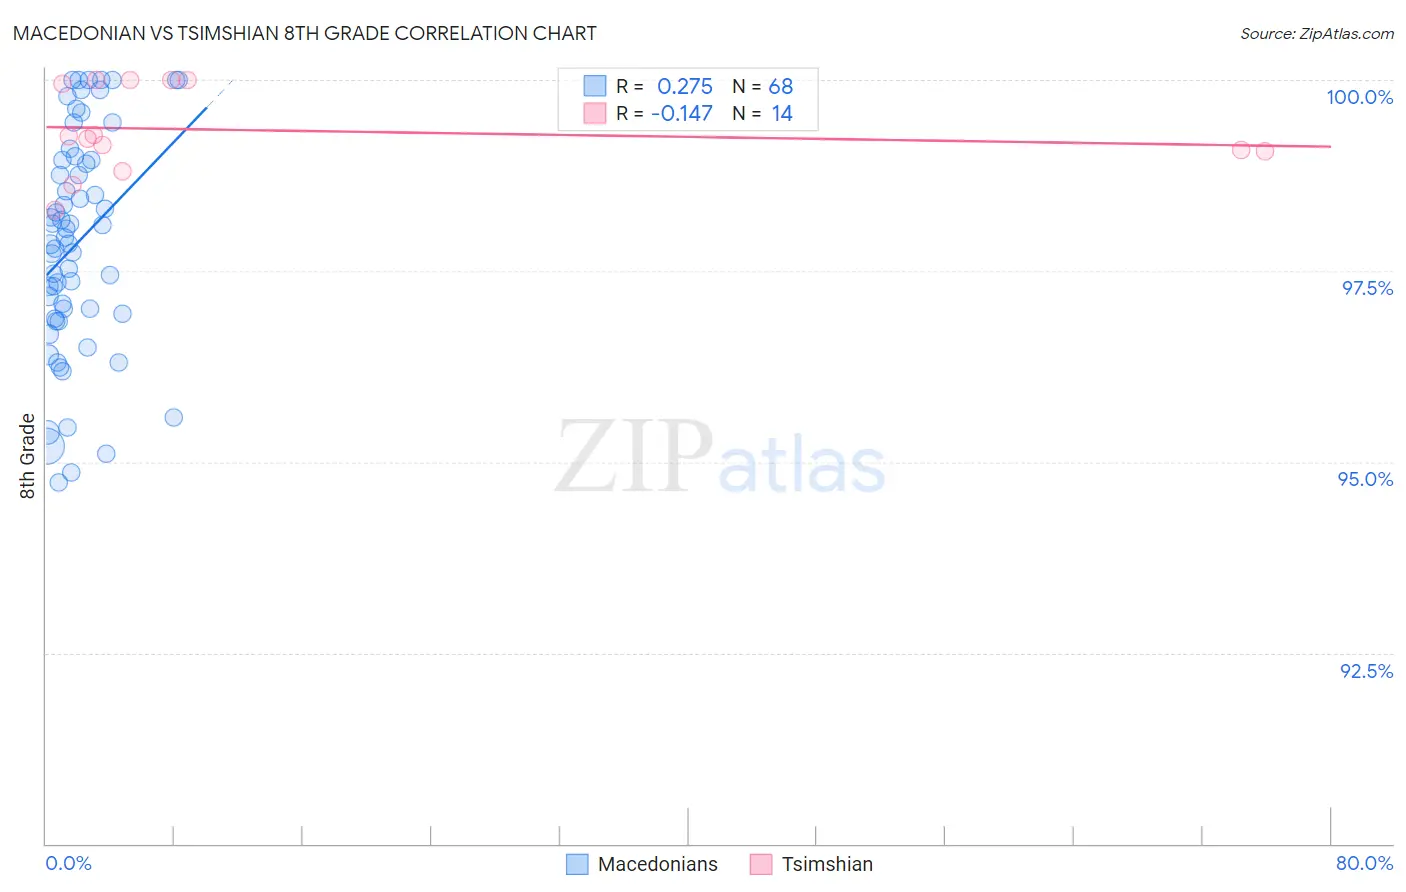
Macedonian vs Tsimshian 8th Grade Correlation Chart
The statistical analysis conducted on geographies consisting of 132,592,860 people shows a weak positive correlation between the proportion of Macedonians and percentage of population with at least 8th grade education in the United States with a correlation coefficient (R) of 0.275 and weighted average of 96.7%. Similarly, the statistical analysis conducted on geographies consisting of 221,806 people shows a poor negative correlation between the proportion of Tsimshian and percentage of population with at least 8th grade education in the United States with a correlation coefficient (R) of -0.147 and weighted average of 99.0%, a difference of 2.3%.
8th Grade Correlation Summary
| Measurement | Macedonian | Tsimshian |
| Minimum | 94.7% | 98.3% |
| Maximum | 100.0% | 100.0% |
| Range | 5.3% | 1.7% |
| Mean | 97.9% | 99.3% |
| Median | 97.9% | 99.2% |
| Interquartile 25% (IQ1) | 96.9% | 99.1% |
| Interquartile 75% (IQ3) | 99.0% | 100.0% |
| Interquartile Range (IQR) | 2.0% | 0.93% |
| Standard Deviation (Sample) | 1.4% | 0.57% |
| Standard Deviation (Population) | 1.4% | 0.55% |
Similar Demographics by 8th Grade
Demographics Similar to Macedonians by 8th Grade
In terms of 8th grade, the demographic groups most similar to Macedonians are Australian (96.7%, a difference of 0.0%), Austrian (96.7%, a difference of 0.010%), Serbian (96.7%, a difference of 0.010%), Russian (96.7%, a difference of 0.010%), and Greek (96.8%, a difference of 0.030%).
| Demographics | Rating | Rank | 8th Grade |
| Immigrants | Scotland | 99.9 /100 | #50 | Exceptional 96.8% |
| Celtics | 99.9 /100 | #51 | Exceptional 96.8% |
| Greeks | 99.9 /100 | #52 | Exceptional 96.8% |
| Austrians | 99.9 /100 | #53 | Exceptional 96.7% |
| Serbians | 99.8 /100 | #54 | Exceptional 96.7% |
| Russians | 99.8 /100 | #55 | Exceptional 96.7% |
| Australians | 99.8 /100 | #56 | Exceptional 96.7% |
| Macedonians | 99.8 /100 | #57 | Exceptional 96.7% |
| Immigrants | Canada | 99.8 /100 | #58 | Exceptional 96.7% |
| Immigrants | North America | 99.8 /100 | #59 | Exceptional 96.7% |
| Immigrants | Northern Europe | 99.8 /100 | #60 | Exceptional 96.7% |
| Immigrants | Austria | 99.8 /100 | #61 | Exceptional 96.7% |
| Whites/Caucasians | 99.8 /100 | #62 | Exceptional 96.7% |
| Ukrainians | 99.7 /100 | #63 | Exceptional 96.7% |
| Immigrants | India | 99.7 /100 | #64 | Exceptional 96.6% |
Demographics Similar to Tsimshian by 8th Grade
In terms of 8th grade, the demographic groups most similar to Tsimshian are Crow (99.0%, a difference of 0.090%), Finnish (98.4%, a difference of 0.60%), Carpatho Rusyn (98.1%, a difference of 0.83%), Ottawa (97.9%, a difference of 1.0%), and Dutch (97.7%, a difference of 1.3%).
| Demographics | Rating | Rank | 8th Grade |
| Crow | 100.0 /100 | #1 | Exceptional 99.0% |
| Tsimshian | 100.0 /100 | #2 | Exceptional 99.0% |
| Finns | 100.0 /100 | #3 | Exceptional 98.4% |
| Carpatho Rusyns | 100.0 /100 | #4 | Exceptional 98.1% |
| Ottawa | 100.0 /100 | #5 | Exceptional 97.9% |
| Dutch | 100.0 /100 | #6 | Exceptional 97.7% |
| Norwegians | 100.0 /100 | #7 | Exceptional 97.6% |
| Slovaks | 100.0 /100 | #8 | Exceptional 97.6% |
| Germans | 100.0 /100 | #9 | Exceptional 97.5% |
| Slovenes | 100.0 /100 | #10 | Exceptional 97.5% |
| Poles | 100.0 /100 | #11 | Exceptional 97.4% |
| Swedes | 100.0 /100 | #12 | Exceptional 97.4% |
| Alaskan Athabascans | 100.0 /100 | #13 | Exceptional 97.3% |
| English | 100.0 /100 | #14 | Exceptional 97.3% |
| Pennsylvania Germans | 100.0 /100 | #15 | Exceptional 97.3% |