Osage vs Tsimshian 8th Grade
COMPARE
Osage
Tsimshian
8th Grade
8th Grade Comparison
Osage
Tsimshian
96.4%
8TH GRADE
98.7/ 100
METRIC RATING
97th/ 347
METRIC RANK
99.0%
8TH GRADE
100.0/ 100
METRIC RATING
2nd/ 347
METRIC RANK
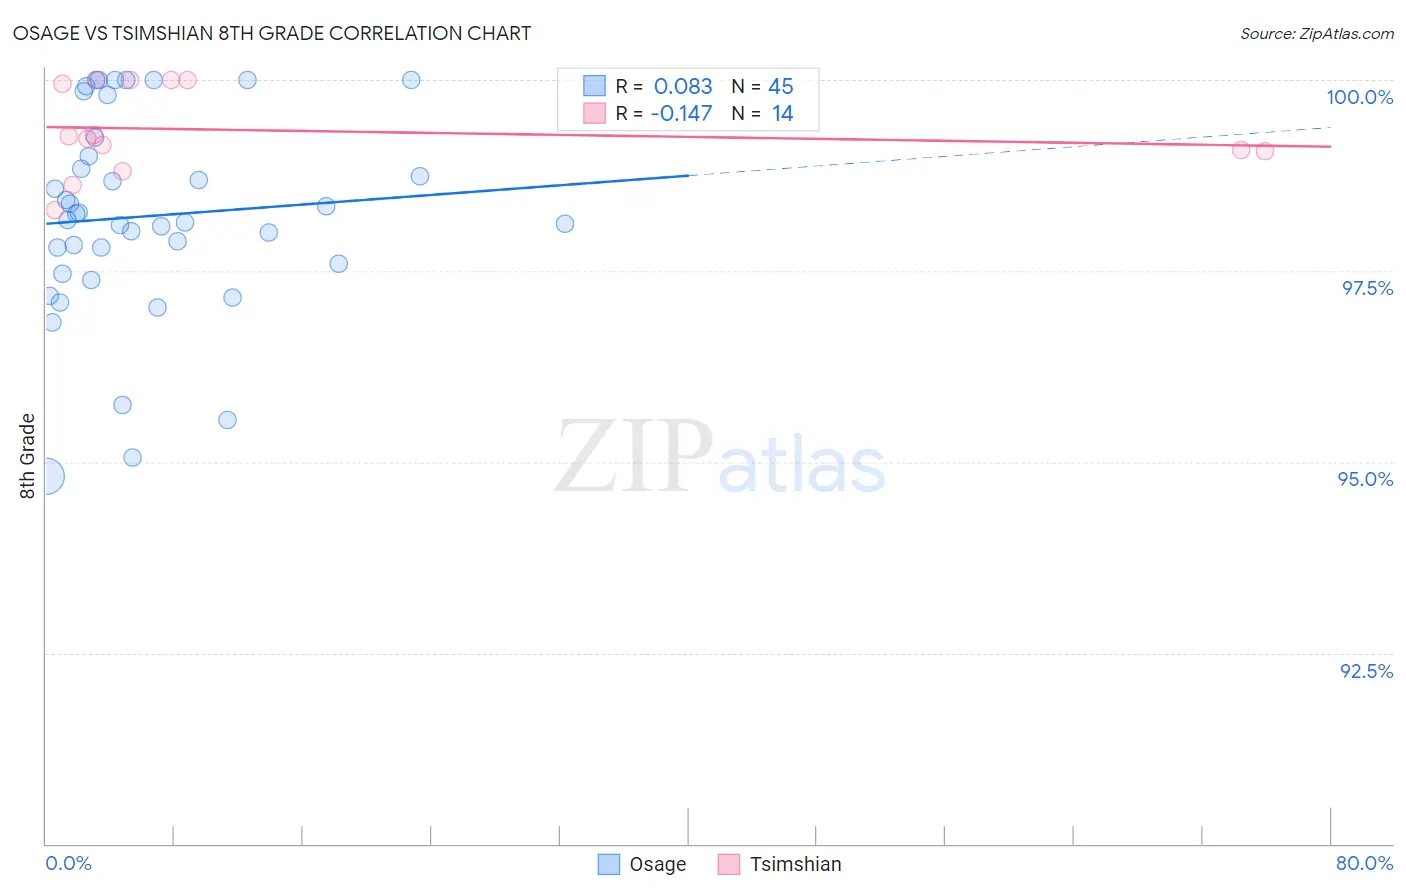
Osage vs Tsimshian 8th Grade Correlation Chart
The statistical analysis conducted on geographies consisting of 91,808,929 people shows a slight positive correlation between the proportion of Osage and percentage of population with at least 8th grade education in the United States with a correlation coefficient (R) of 0.083 and weighted average of 96.4%. Similarly, the statistical analysis conducted on geographies consisting of 221,806 people shows a poor negative correlation between the proportion of Tsimshian and percentage of population with at least 8th grade education in the United States with a correlation coefficient (R) of -0.147 and weighted average of 99.0%, a difference of 2.6%.
8th Grade Correlation Summary
| Measurement | Osage | Tsimshian |
| Minimum | 94.8% | 98.3% |
| Maximum | 100.0% | 100.0% |
| Range | 5.2% | 1.7% |
| Mean | 98.2% | 99.3% |
| Median | 98.2% | 99.2% |
| Interquartile 25% (IQ1) | 97.5% | 99.1% |
| Interquartile 75% (IQ3) | 99.1% | 100.0% |
| Interquartile Range (IQR) | 1.6% | 0.93% |
| Standard Deviation (Sample) | 1.3% | 0.57% |
| Standard Deviation (Population) | 1.3% | 0.55% |
Similar Demographics by 8th Grade
Demographics Similar to Osage by 8th Grade
In terms of 8th grade, the demographic groups most similar to Osage are Potawatomi (96.4%, a difference of 0.0%), Immigrants from Germany (96.4%, a difference of 0.0%), Cree (96.4%, a difference of 0.0%), Immigrants from Singapore (96.4%, a difference of 0.010%), and German Russian (96.4%, a difference of 0.010%).
| Demographics | Rating | Rank | 8th Grade |
| Immigrants | Sweden | 98.9 /100 | #90 | Exceptional 96.4% |
| Thais | 98.9 /100 | #91 | Exceptional 96.4% |
| Menominee | 98.9 /100 | #92 | Exceptional 96.4% |
| Immigrants | Denmark | 98.8 /100 | #93 | Exceptional 96.4% |
| Immigrants | Singapore | 98.8 /100 | #94 | Exceptional 96.4% |
| German Russians | 98.8 /100 | #95 | Exceptional 96.4% |
| Potawatomi | 98.7 /100 | #96 | Exceptional 96.4% |
| Osage | 98.7 /100 | #97 | Exceptional 96.4% |
| Immigrants | Germany | 98.7 /100 | #98 | Exceptional 96.4% |
| Cree | 98.6 /100 | #99 | Exceptional 96.4% |
| Immigrants | Czechoslovakia | 98.6 /100 | #100 | Exceptional 96.4% |
| Bhutanese | 98.2 /100 | #101 | Exceptional 96.4% |
| South Africans | 98.2 /100 | #102 | Exceptional 96.4% |
| Immigrants | Saudi Arabia | 98.0 /100 | #103 | Exceptional 96.3% |
| Kiowa | 98.0 /100 | #104 | Exceptional 96.3% |
Demographics Similar to Tsimshian by 8th Grade
In terms of 8th grade, the demographic groups most similar to Tsimshian are Crow (99.0%, a difference of 0.090%), Finnish (98.4%, a difference of 0.60%), Carpatho Rusyn (98.1%, a difference of 0.83%), Ottawa (97.9%, a difference of 1.0%), and Dutch (97.7%, a difference of 1.3%).
| Demographics | Rating | Rank | 8th Grade |
| Crow | 100.0 /100 | #1 | Exceptional 99.0% |
| Tsimshian | 100.0 /100 | #2 | Exceptional 99.0% |
| Finns | 100.0 /100 | #3 | Exceptional 98.4% |
| Carpatho Rusyns | 100.0 /100 | #4 | Exceptional 98.1% |
| Ottawa | 100.0 /100 | #5 | Exceptional 97.9% |
| Dutch | 100.0 /100 | #6 | Exceptional 97.7% |
| Norwegians | 100.0 /100 | #7 | Exceptional 97.6% |
| Slovaks | 100.0 /100 | #8 | Exceptional 97.6% |
| Germans | 100.0 /100 | #9 | Exceptional 97.5% |
| Slovenes | 100.0 /100 | #10 | Exceptional 97.5% |
| Poles | 100.0 /100 | #11 | Exceptional 97.4% |
| Swedes | 100.0 /100 | #12 | Exceptional 97.4% |
| Alaskan Athabascans | 100.0 /100 | #13 | Exceptional 97.3% |
| English | 100.0 /100 | #14 | Exceptional 97.3% |
| Pennsylvania Germans | 100.0 /100 | #15 | Exceptional 97.3% |