Immigrants from Central America vs Tsimshian 8th Grade
COMPARE
Immigrants from Central America
Tsimshian
8th Grade
8th Grade Comparison
Immigrants from Central America
Tsimshian
90.4%
8TH GRADE
0.0/ 100
METRIC RATING
344th/ 347
METRIC RANK
99.0%
8TH GRADE
100.0/ 100
METRIC RATING
2nd/ 347
METRIC RANK
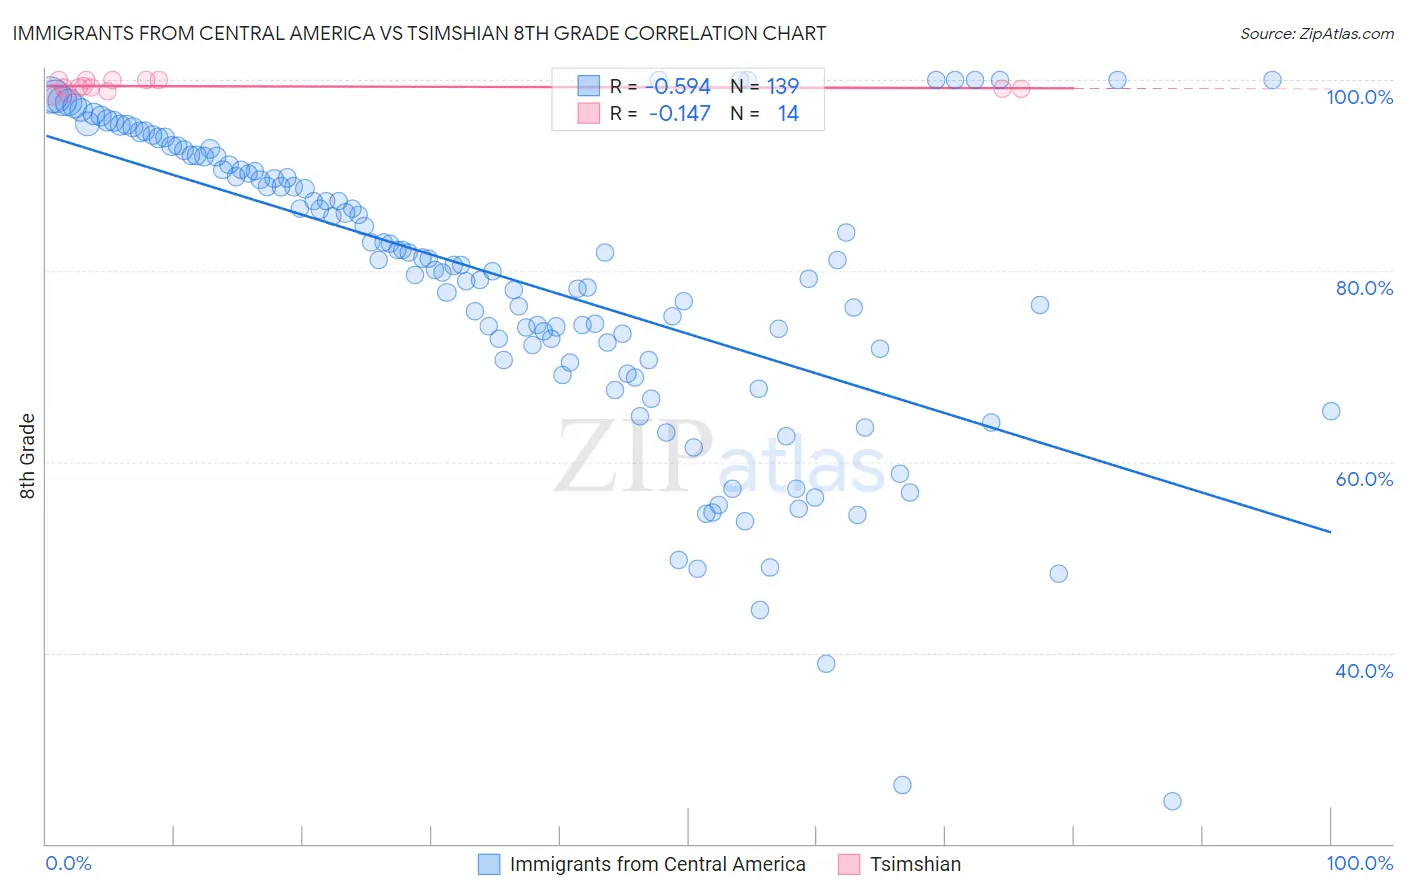
Immigrants from Central America vs Tsimshian 8th Grade Correlation Chart
The statistical analysis conducted on geographies consisting of 536,553,849 people shows a substantial negative correlation between the proportion of Immigrants from Central America and percentage of population with at least 8th grade education in the United States with a correlation coefficient (R) of -0.594 and weighted average of 90.4%. Similarly, the statistical analysis conducted on geographies consisting of 221,806 people shows a poor negative correlation between the proportion of Tsimshian and percentage of population with at least 8th grade education in the United States with a correlation coefficient (R) of -0.147 and weighted average of 99.0%, a difference of 9.5%.
8th Grade Correlation Summary
| Measurement | Immigrants from Central America | Tsimshian |
| Minimum | 24.5% | 98.3% |
| Maximum | 100.0% | 100.0% |
| Range | 75.5% | 1.7% |
| Mean | 79.2% | 99.3% |
| Median | 81.2% | 99.2% |
| Interquartile 25% (IQ1) | 70.6% | 99.1% |
| Interquartile 75% (IQ3) | 92.0% | 100.0% |
| Interquartile Range (IQR) | 21.4% | 0.93% |
| Standard Deviation (Sample) | 15.8% | 0.57% |
| Standard Deviation (Population) | 15.7% | 0.55% |
Similar Demographics by 8th Grade
Demographics Similar to Immigrants from Central America by 8th Grade
In terms of 8th grade, the demographic groups most similar to Immigrants from Central America are Immigrants from El Salvador (90.3%, a difference of 0.090%), Immigrants from Mexico (90.2%, a difference of 0.27%), Immigrants from Guatemala (90.7%, a difference of 0.37%), Salvadoran (90.9%, a difference of 0.54%), and Spanish American Indian (89.8%, a difference of 0.71%).
| Demographics | Rating | Rank | 8th Grade |
| Hispanics or Latinos | 0.0 /100 | #333 | Tragic 92.2% |
| Immigrants | Yemen | 0.0 /100 | #334 | Tragic 92.1% |
| Mexican American Indians | 0.0 /100 | #335 | Tragic 92.1% |
| Immigrants | Honduras | 0.0 /100 | #336 | Tragic 91.9% |
| Immigrants | Latin America | 0.0 /100 | #337 | Tragic 91.7% |
| Central Americans | 0.0 /100 | #338 | Tragic 91.6% |
| Mexicans | 0.0 /100 | #339 | Tragic 91.4% |
| Yakama | 0.0 /100 | #340 | Tragic 91.2% |
| Guatemalans | 0.0 /100 | #341 | Tragic 91.1% |
| Salvadorans | 0.0 /100 | #342 | Tragic 90.9% |
| Immigrants | Guatemala | 0.0 /100 | #343 | Tragic 90.7% |
| Immigrants | Central America | 0.0 /100 | #344 | Tragic 90.4% |
| Immigrants | El Salvador | 0.0 /100 | #345 | Tragic 90.3% |
| Immigrants | Mexico | 0.0 /100 | #346 | Tragic 90.2% |
| Spanish American Indians | 0.0 /100 | #347 | Tragic 89.8% |
Demographics Similar to Tsimshian by 8th Grade
In terms of 8th grade, the demographic groups most similar to Tsimshian are Crow (99.0%, a difference of 0.090%), Finnish (98.4%, a difference of 0.60%), Carpatho Rusyn (98.1%, a difference of 0.83%), Ottawa (97.9%, a difference of 1.0%), and Dutch (97.7%, a difference of 1.3%).
| Demographics | Rating | Rank | 8th Grade |
| Crow | 100.0 /100 | #1 | Exceptional 99.0% |
| Tsimshian | 100.0 /100 | #2 | Exceptional 99.0% |
| Finns | 100.0 /100 | #3 | Exceptional 98.4% |
| Carpatho Rusyns | 100.0 /100 | #4 | Exceptional 98.1% |
| Ottawa | 100.0 /100 | #5 | Exceptional 97.9% |
| Dutch | 100.0 /100 | #6 | Exceptional 97.7% |
| Norwegians | 100.0 /100 | #7 | Exceptional 97.6% |
| Slovaks | 100.0 /100 | #8 | Exceptional 97.6% |
| Germans | 100.0 /100 | #9 | Exceptional 97.5% |
| Slovenes | 100.0 /100 | #10 | Exceptional 97.5% |
| Poles | 100.0 /100 | #11 | Exceptional 97.4% |
| Swedes | 100.0 /100 | #12 | Exceptional 97.4% |
| Alaskan Athabascans | 100.0 /100 | #13 | Exceptional 97.3% |
| English | 100.0 /100 | #14 | Exceptional 97.3% |
| Pennsylvania Germans | 100.0 /100 | #15 | Exceptional 97.3% |