Albanian vs Tsimshian 8th Grade
COMPARE
Albanian
Tsimshian
8th Grade
8th Grade Comparison
Albanians
Tsimshian
96.0%
8TH GRADE
83.1/ 100
METRIC RATING
148th/ 347
METRIC RANK
99.0%
8TH GRADE
100.0/ 100
METRIC RATING
2nd/ 347
METRIC RANK
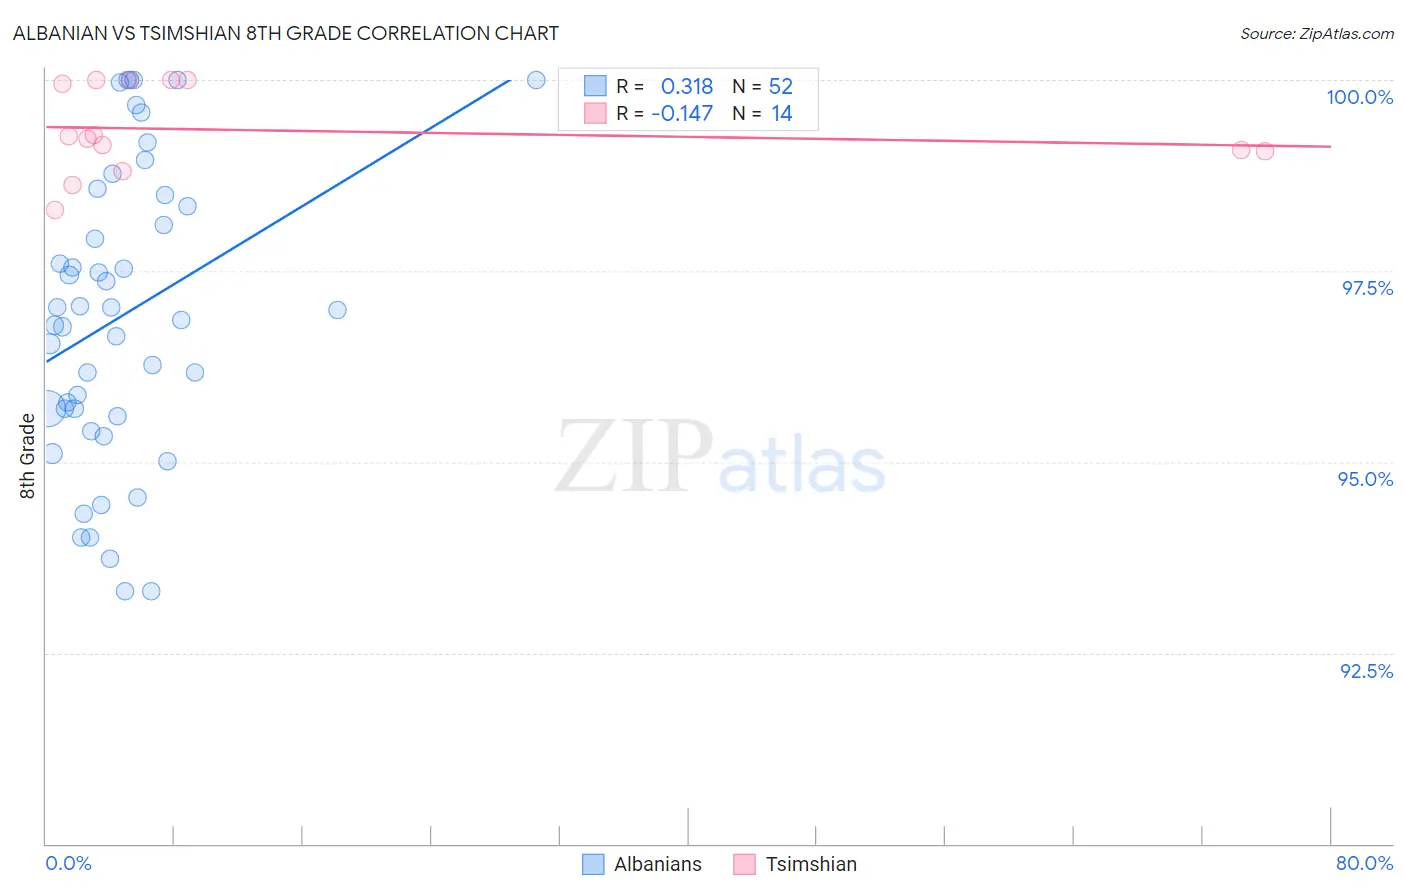
Albanian vs Tsimshian 8th Grade Correlation Chart
The statistical analysis conducted on geographies consisting of 193,265,850 people shows a mild positive correlation between the proportion of Albanians and percentage of population with at least 8th grade education in the United States with a correlation coefficient (R) of 0.318 and weighted average of 96.0%. Similarly, the statistical analysis conducted on geographies consisting of 221,806 people shows a poor negative correlation between the proportion of Tsimshian and percentage of population with at least 8th grade education in the United States with a correlation coefficient (R) of -0.147 and weighted average of 99.0%, a difference of 3.1%.
8th Grade Correlation Summary
| Measurement | Albanian | Tsimshian |
| Minimum | 93.3% | 98.3% |
| Maximum | 100.0% | 100.0% |
| Range | 6.7% | 1.7% |
| Mean | 96.9% | 99.3% |
| Median | 96.9% | 99.2% |
| Interquartile 25% (IQ1) | 95.6% | 99.1% |
| Interquartile 75% (IQ3) | 98.4% | 100.0% |
| Interquartile Range (IQR) | 2.8% | 0.93% |
| Standard Deviation (Sample) | 1.9% | 0.57% |
| Standard Deviation (Population) | 1.9% | 0.55% |
Similar Demographics by 8th Grade
Demographics Similar to Albanians by 8th Grade
In terms of 8th grade, the demographic groups most similar to Albanians are Lumbee (96.0%, a difference of 0.010%), Israeli (96.0%, a difference of 0.010%), Colville (96.0%, a difference of 0.010%), Spanish (96.0%, a difference of 0.020%), and Immigrants from Belarus (96.0%, a difference of 0.020%).
| Demographics | Rating | Rank | 8th Grade |
| Immigrants | Greece | 85.9 /100 | #141 | Excellent 96.0% |
| Immigrants | Eastern Europe | 85.4 /100 | #142 | Excellent 96.0% |
| Spanish | 85.1 /100 | #143 | Excellent 96.0% |
| Immigrants | Belarus | 84.8 /100 | #144 | Excellent 96.0% |
| Lumbee | 84.1 /100 | #145 | Excellent 96.0% |
| Israelis | 84.1 /100 | #146 | Excellent 96.0% |
| Colville | 84.0 /100 | #147 | Excellent 96.0% |
| Albanians | 83.1 /100 | #148 | Excellent 96.0% |
| Immigrants | Israel | 81.3 /100 | #149 | Excellent 96.0% |
| Immigrants | Russia | 80.9 /100 | #150 | Excellent 96.0% |
| Blackfeet | 80.8 /100 | #151 | Excellent 96.0% |
| French American Indians | 80.6 /100 | #152 | Excellent 96.0% |
| Immigrants | Jordan | 79.5 /100 | #153 | Good 95.9% |
| Hopi | 79.4 /100 | #154 | Good 95.9% |
| Kenyans | 74.5 /100 | #155 | Good 95.9% |
Demographics Similar to Tsimshian by 8th Grade
In terms of 8th grade, the demographic groups most similar to Tsimshian are Crow (99.0%, a difference of 0.090%), Finnish (98.4%, a difference of 0.60%), Carpatho Rusyn (98.1%, a difference of 0.83%), Ottawa (97.9%, a difference of 1.0%), and Dutch (97.7%, a difference of 1.3%).
| Demographics | Rating | Rank | 8th Grade |
| Crow | 100.0 /100 | #1 | Exceptional 99.0% |
| Tsimshian | 100.0 /100 | #2 | Exceptional 99.0% |
| Finns | 100.0 /100 | #3 | Exceptional 98.4% |
| Carpatho Rusyns | 100.0 /100 | #4 | Exceptional 98.1% |
| Ottawa | 100.0 /100 | #5 | Exceptional 97.9% |
| Dutch | 100.0 /100 | #6 | Exceptional 97.7% |
| Norwegians | 100.0 /100 | #7 | Exceptional 97.6% |
| Slovaks | 100.0 /100 | #8 | Exceptional 97.6% |
| Germans | 100.0 /100 | #9 | Exceptional 97.5% |
| Slovenes | 100.0 /100 | #10 | Exceptional 97.5% |
| Poles | 100.0 /100 | #11 | Exceptional 97.4% |
| Swedes | 100.0 /100 | #12 | Exceptional 97.4% |
| Alaskan Athabascans | 100.0 /100 | #13 | Exceptional 97.3% |
| English | 100.0 /100 | #14 | Exceptional 97.3% |
| Pennsylvania Germans | 100.0 /100 | #15 | Exceptional 97.3% |