Norwegian vs Immigrants from Scotland Single Male Poverty
COMPARE
Norwegian
Immigrants from Scotland
Single Male Poverty
Single Male Poverty Comparison
Norwegians
Immigrants from Scotland
12.9%
SINGLE MALE POVERTY
32.0/ 100
METRIC RATING
185th/ 347
METRIC RANK
12.7%
SINGLE MALE POVERTY
68.9/ 100
METRIC RATING
154th/ 347
METRIC RANK
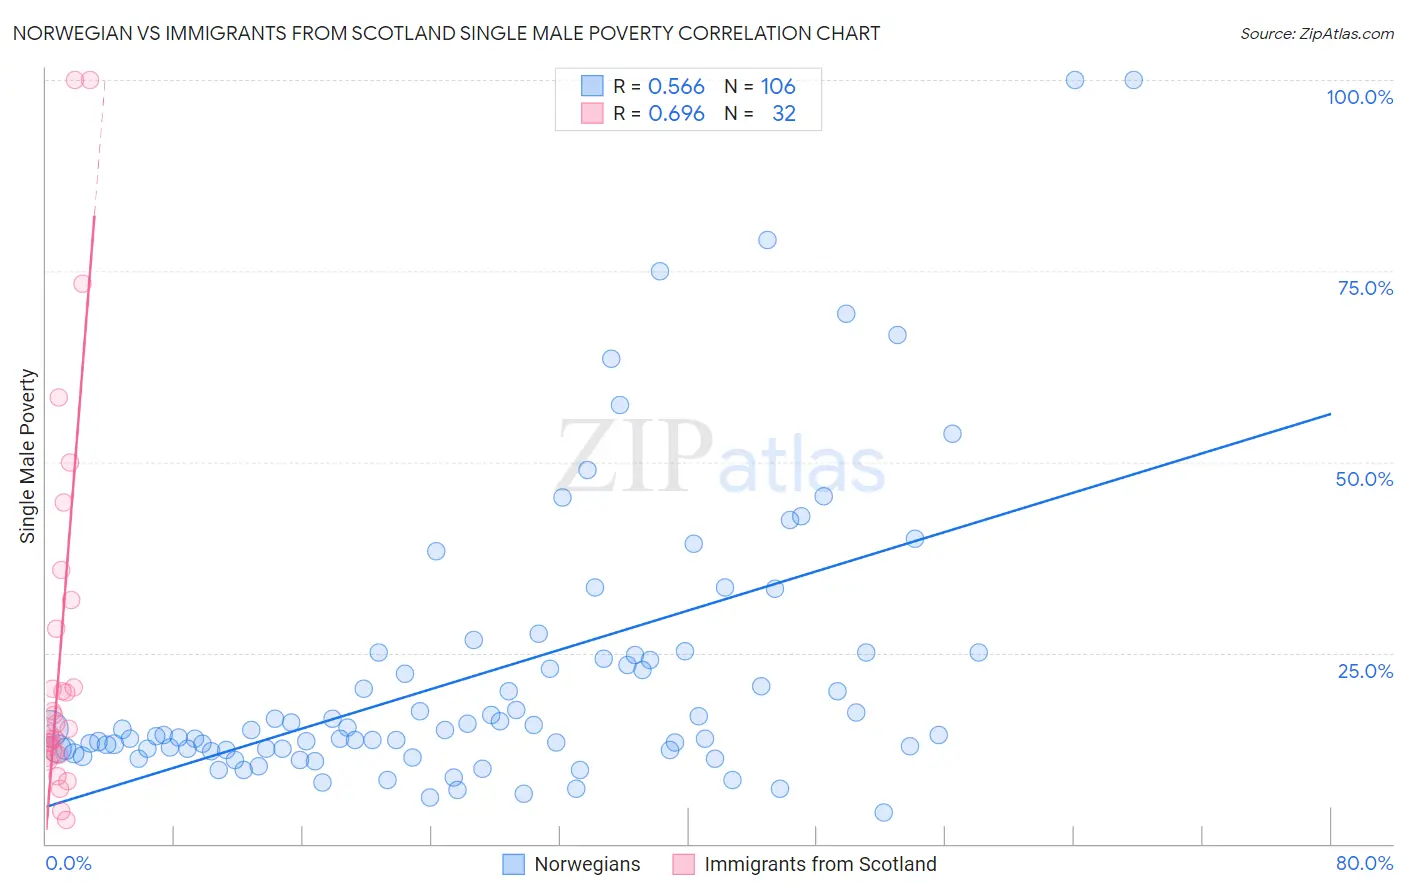
Norwegian vs Immigrants from Scotland Single Male Poverty Correlation Chart
The statistical analysis conducted on geographies consisting of 445,954,160 people shows a substantial positive correlation between the proportion of Norwegians and poverty level among single males in the United States with a correlation coefficient (R) of 0.566 and weighted average of 12.9%. Similarly, the statistical analysis conducted on geographies consisting of 179,195,649 people shows a significant positive correlation between the proportion of Immigrants from Scotland and poverty level among single males in the United States with a correlation coefficient (R) of 0.696 and weighted average of 12.7%, a difference of 2.1%.
Single Male Poverty Correlation Summary
| Measurement | Norwegian | Immigrants from Scotland |
| Minimum | 4.2% | 3.1% |
| Maximum | 100.0% | 100.0% |
| Range | 95.8% | 96.9% |
| Mean | 22.4% | 25.8% |
| Median | 14.6% | 15.4% |
| Interquartile 25% (IQ1) | 12.4% | 11.9% |
| Interquartile 75% (IQ3) | 24.7% | 30.0% |
| Interquartile Range (IQR) | 12.3% | 18.1% |
| Standard Deviation (Sample) | 18.9% | 25.1% |
| Standard Deviation (Population) | 18.8% | 24.7% |
Similar Demographics by Single Male Poverty
Demographics Similar to Norwegians by Single Male Poverty
In terms of single male poverty, the demographic groups most similar to Norwegians are Nigerian (12.9%, a difference of 0.0%), Immigrants from Kuwait (12.9%, a difference of 0.010%), Immigrants from Trinidad and Tobago (12.9%, a difference of 0.030%), Macedonian (12.9%, a difference of 0.030%), and Immigrants from West Indies (12.9%, a difference of 0.060%).
| Demographics | Rating | Rank | Single Male Poverty |
| Immigrants | Switzerland | 43.1 /100 | #178 | Average 12.8% |
| Israelis | 41.0 /100 | #179 | Average 12.9% |
| Immigrants | North America | 37.7 /100 | #180 | Fair 12.9% |
| Panamanians | 37.6 /100 | #181 | Fair 12.9% |
| Moroccans | 36.8 /100 | #182 | Fair 12.9% |
| Immigrants | West Indies | 33.0 /100 | #183 | Fair 12.9% |
| Immigrants | Trinidad and Tobago | 32.5 /100 | #184 | Fair 12.9% |
| Norwegians | 32.0 /100 | #185 | Fair 12.9% |
| Nigerians | 31.9 /100 | #186 | Fair 12.9% |
| Immigrants | Kuwait | 31.9 /100 | #187 | Fair 12.9% |
| Macedonians | 31.5 /100 | #188 | Fair 12.9% |
| Portuguese | 30.2 /100 | #189 | Fair 12.9% |
| Arabs | 27.0 /100 | #190 | Fair 13.0% |
| Immigrants | Thailand | 26.6 /100 | #191 | Fair 13.0% |
| Immigrants | Jamaica | 26.5 /100 | #192 | Fair 13.0% |
Demographics Similar to Immigrants from Scotland by Single Male Poverty
In terms of single male poverty, the demographic groups most similar to Immigrants from Scotland are Immigrants from Spain (12.7%, a difference of 0.020%), Vietnamese (12.7%, a difference of 0.060%), Latvian (12.7%, a difference of 0.060%), Immigrants (12.7%, a difference of 0.070%), and Australian (12.6%, a difference of 0.16%).
| Demographics | Rating | Rank | Single Male Poverty |
| Malaysians | 74.8 /100 | #147 | Good 12.6% |
| Yugoslavians | 73.9 /100 | #148 | Good 12.6% |
| Sierra Leoneans | 73.0 /100 | #149 | Good 12.6% |
| Immigrants | Panama | 72.1 /100 | #150 | Good 12.6% |
| Immigrants | Hungary | 71.9 /100 | #151 | Good 12.6% |
| Australians | 71.4 /100 | #152 | Good 12.6% |
| Immigrants | Immigrants | 70.1 /100 | #153 | Good 12.7% |
| Immigrants | Scotland | 68.9 /100 | #154 | Good 12.7% |
| Immigrants | Spain | 68.7 /100 | #155 | Good 12.7% |
| Vietnamese | 67.9 /100 | #156 | Good 12.7% |
| Latvians | 67.9 /100 | #157 | Good 12.7% |
| Immigrants | Middle Africa | 64.9 /100 | #158 | Good 12.7% |
| Immigrants | Liberia | 64.2 /100 | #159 | Good 12.7% |
| Greeks | 64.1 /100 | #160 | Good 12.7% |
| Immigrants | Africa | 63.4 /100 | #161 | Good 12.7% |