Nigerian vs Polish Associate's Degree
COMPARE
Nigerian
Polish
Associate's Degree
Associate's Degree Comparison
Nigerians
Poles
45.1%
ASSOCIATE'S DEGREE
19.1/ 100
METRIC RATING
204th/ 347
METRIC RANK
48.0%
ASSOCIATE'S DEGREE
87.3/ 100
METRIC RATING
138th/ 347
METRIC RANK
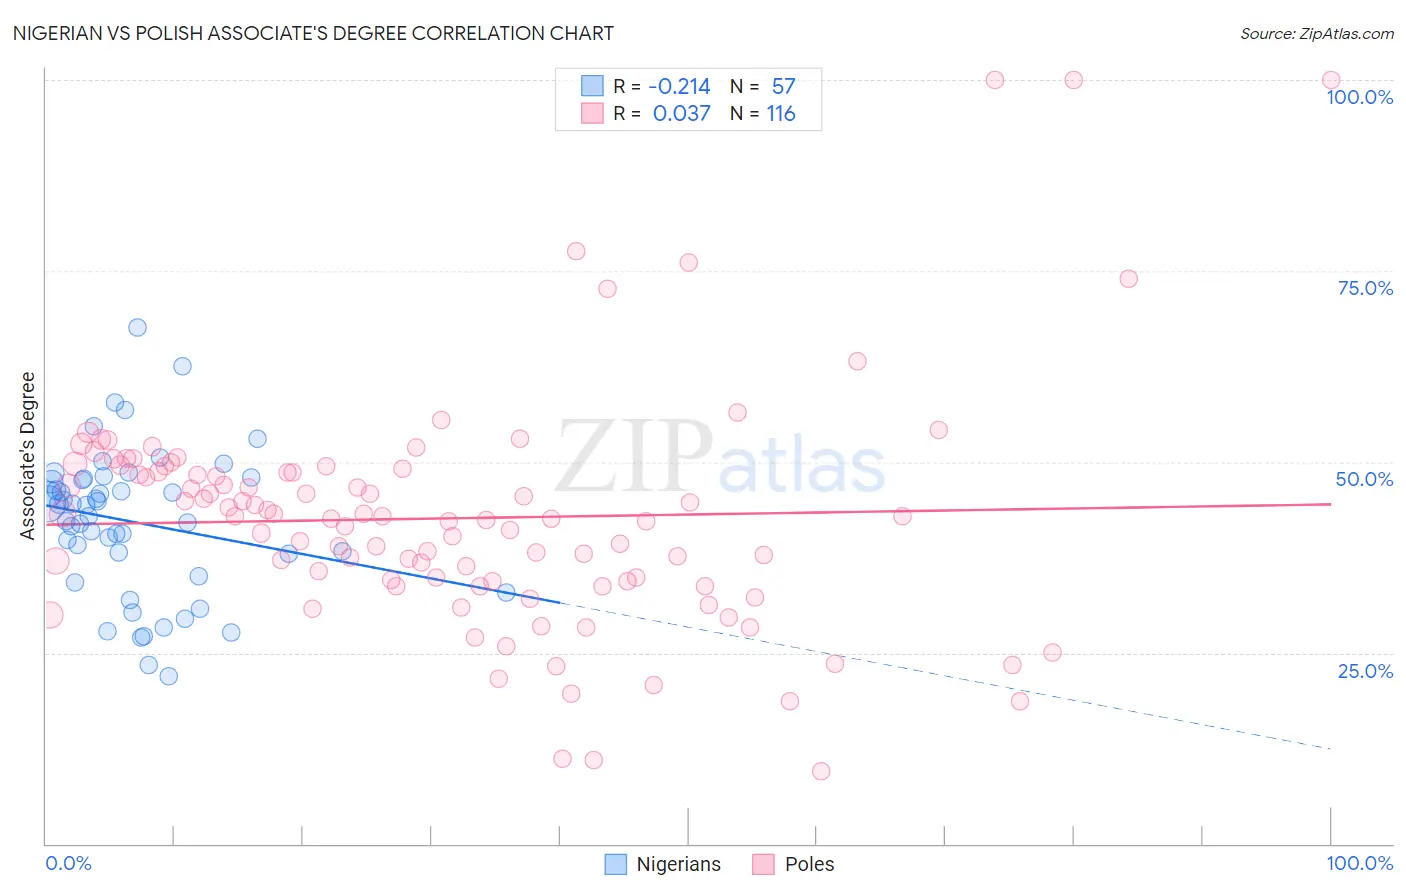
Nigerian vs Polish Associate's Degree Correlation Chart
The statistical analysis conducted on geographies consisting of 332,751,702 people shows a weak negative correlation between the proportion of Nigerians and percentage of population with at least associate's degree education in the United States with a correlation coefficient (R) of -0.214 and weighted average of 45.1%. Similarly, the statistical analysis conducted on geographies consisting of 560,512,147 people shows no correlation between the proportion of Poles and percentage of population with at least associate's degree education in the United States with a correlation coefficient (R) of 0.037 and weighted average of 48.0%, a difference of 6.5%.
Associate's Degree Correlation Summary
| Measurement | Nigerian | Polish |
| Minimum | 22.0% | 9.5% |
| Maximum | 67.5% | 100.0% |
| Range | 45.6% | 90.5% |
| Mean | 42.1% | 42.6% |
| Median | 44.3% | 42.7% |
| Interquartile 25% (IQ1) | 36.5% | 34.4% |
| Interquartile 75% (IQ3) | 47.7% | 48.9% |
| Interquartile Range (IQR) | 11.2% | 14.5% |
| Standard Deviation (Sample) | 9.4% | 15.3% |
| Standard Deviation (Population) | 9.4% | 15.2% |
Similar Demographics by Associate's Degree
Demographics Similar to Nigerians by Associate's Degree
In terms of associate's degree, the demographic groups most similar to Nigerians are Immigrants from Thailand (45.1%, a difference of 0.020%), German Russian (45.1%, a difference of 0.030%), Panamanian (45.1%, a difference of 0.090%), Immigrants from South Eastern Asia (45.2%, a difference of 0.14%), and Spaniard (45.2%, a difference of 0.16%).
| Demographics | Rating | Rank | Associate's Degree |
| Scotch-Irish | 22.3 /100 | #197 | Fair 45.3% |
| Immigrants | Bangladesh | 21.3 /100 | #198 | Fair 45.2% |
| Immigrants | Senegal | 21.2 /100 | #199 | Fair 45.2% |
| Senegalese | 21.1 /100 | #200 | Fair 45.2% |
| Immigrants | Vietnam | 20.8 /100 | #201 | Fair 45.2% |
| Spaniards | 20.4 /100 | #202 | Fair 45.2% |
| Immigrants | South Eastern Asia | 20.2 /100 | #203 | Fair 45.2% |
| Nigerians | 19.1 /100 | #204 | Poor 45.1% |
| Immigrants | Thailand | 18.9 /100 | #205 | Poor 45.1% |
| German Russians | 18.9 /100 | #206 | Poor 45.1% |
| Panamanians | 18.4 /100 | #207 | Poor 45.1% |
| Dutch | 17.6 /100 | #208 | Poor 45.0% |
| Immigrants | Costa Rica | 16.7 /100 | #209 | Poor 45.0% |
| Immigrants | Philippines | 16.7 /100 | #210 | Poor 45.0% |
| Immigrants | Zaire | 16.6 /100 | #211 | Poor 45.0% |
Demographics Similar to Poles by Associate's Degree
In terms of associate's degree, the demographic groups most similar to Poles are Immigrants from Eritrea (48.1%, a difference of 0.070%), Pakistani (48.1%, a difference of 0.11%), European (48.2%, a difference of 0.29%), Moroccan (48.2%, a difference of 0.35%), and Slovene (47.9%, a difference of 0.35%).
| Demographics | Rating | Rank | Associate's Degree |
| Icelanders | 90.8 /100 | #131 | Exceptional 48.3% |
| Immigrants | Albania | 89.9 /100 | #132 | Excellent 48.2% |
| Assyrians/Chaldeans/Syriacs | 89.4 /100 | #133 | Excellent 48.2% |
| Moroccans | 89.3 /100 | #134 | Excellent 48.2% |
| Europeans | 89.0 /100 | #135 | Excellent 48.2% |
| Pakistanis | 88.0 /100 | #136 | Excellent 48.1% |
| Immigrants | Eritrea | 87.8 /100 | #137 | Excellent 48.1% |
| Poles | 87.3 /100 | #138 | Excellent 48.0% |
| Slovenes | 85.1 /100 | #139 | Excellent 47.9% |
| Immigrants | Southern Europe | 84.4 /100 | #140 | Excellent 47.8% |
| Taiwanese | 83.3 /100 | #141 | Excellent 47.7% |
| Sierra Leoneans | 82.9 /100 | #142 | Excellent 47.7% |
| Norwegians | 81.0 /100 | #143 | Excellent 47.6% |
| Slavs | 80.5 /100 | #144 | Excellent 47.6% |
| Canadians | 79.0 /100 | #145 | Good 47.5% |