Nigerian vs Immigrants from Cabo Verde Associate's Degree
COMPARE
Nigerian
Immigrants from Cabo Verde
Associate's Degree
Associate's Degree Comparison
Nigerians
Immigrants from Cabo Verde
45.1%
ASSOCIATE'S DEGREE
19.1/ 100
METRIC RATING
204th/ 347
METRIC RANK
36.8%
ASSOCIATE'S DEGREE
0.0/ 100
METRIC RATING
323rd/ 347
METRIC RANK
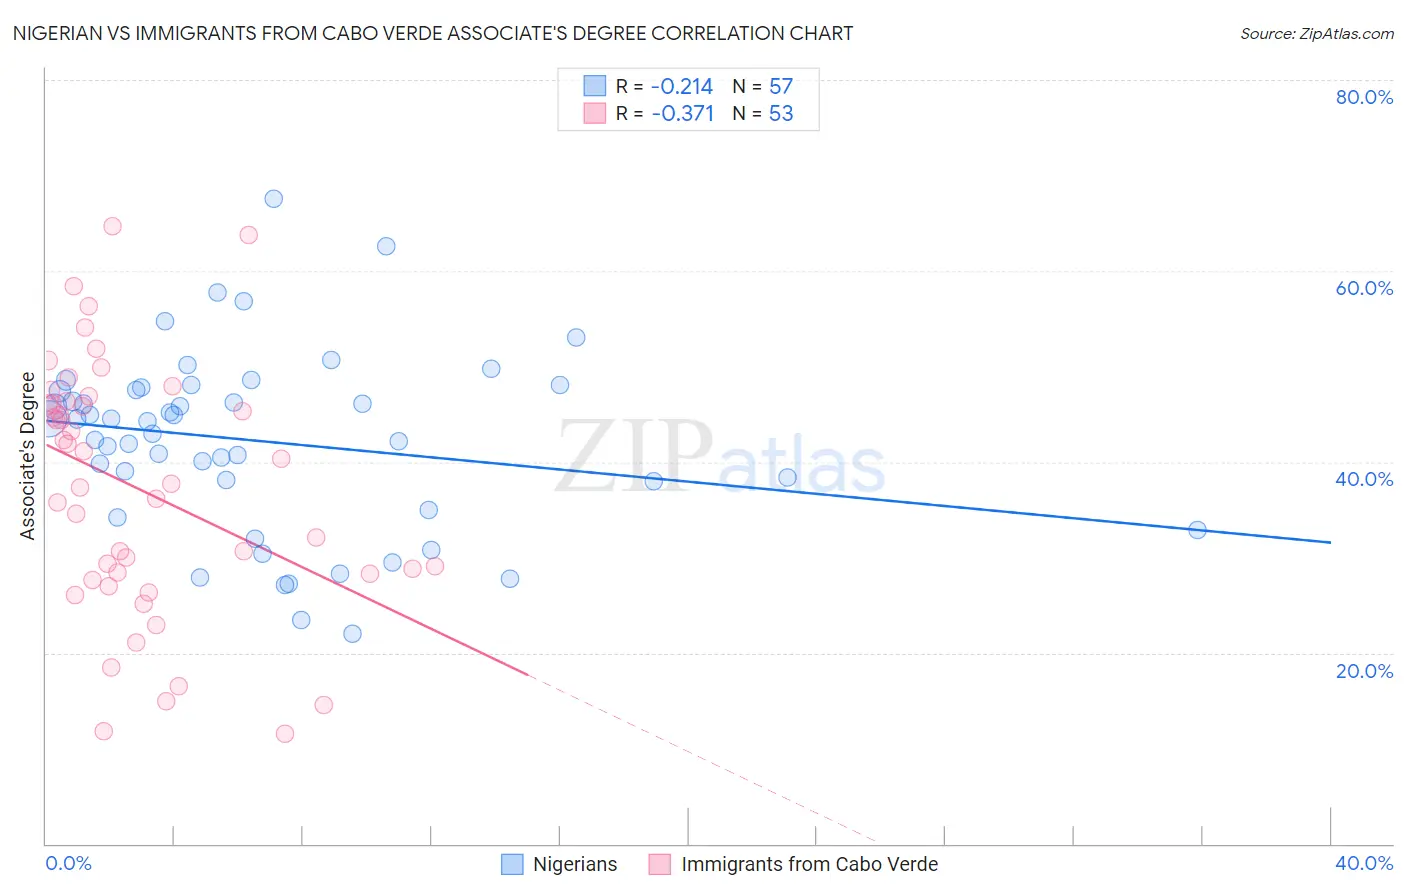
Nigerian vs Immigrants from Cabo Verde Associate's Degree Correlation Chart
The statistical analysis conducted on geographies consisting of 332,751,702 people shows a weak negative correlation between the proportion of Nigerians and percentage of population with at least associate's degree education in the United States with a correlation coefficient (R) of -0.214 and weighted average of 45.1%. Similarly, the statistical analysis conducted on geographies consisting of 38,158,666 people shows a mild negative correlation between the proportion of Immigrants from Cabo Verde and percentage of population with at least associate's degree education in the United States with a correlation coefficient (R) of -0.371 and weighted average of 36.8%, a difference of 22.6%.
Associate's Degree Correlation Summary
| Measurement | Nigerian | Immigrants from Cabo Verde |
| Minimum | 22.0% | 11.5% |
| Maximum | 67.5% | 64.7% |
| Range | 45.6% | 53.3% |
| Mean | 42.1% | 37.2% |
| Median | 44.3% | 37.7% |
| Interquartile 25% (IQ1) | 36.5% | 28.0% |
| Interquartile 75% (IQ3) | 47.7% | 46.2% |
| Interquartile Range (IQR) | 11.2% | 18.3% |
| Standard Deviation (Sample) | 9.4% | 13.1% |
| Standard Deviation (Population) | 9.4% | 13.0% |
Similar Demographics by Associate's Degree
Demographics Similar to Nigerians by Associate's Degree
In terms of associate's degree, the demographic groups most similar to Nigerians are Immigrants from Thailand (45.1%, a difference of 0.020%), German Russian (45.1%, a difference of 0.030%), Panamanian (45.1%, a difference of 0.090%), Immigrants from South Eastern Asia (45.2%, a difference of 0.14%), and Spaniard (45.2%, a difference of 0.16%).
| Demographics | Rating | Rank | Associate's Degree |
| Scotch-Irish | 22.3 /100 | #197 | Fair 45.3% |
| Immigrants | Bangladesh | 21.3 /100 | #198 | Fair 45.2% |
| Immigrants | Senegal | 21.2 /100 | #199 | Fair 45.2% |
| Senegalese | 21.1 /100 | #200 | Fair 45.2% |
| Immigrants | Vietnam | 20.8 /100 | #201 | Fair 45.2% |
| Spaniards | 20.4 /100 | #202 | Fair 45.2% |
| Immigrants | South Eastern Asia | 20.2 /100 | #203 | Fair 45.2% |
| Nigerians | 19.1 /100 | #204 | Poor 45.1% |
| Immigrants | Thailand | 18.9 /100 | #205 | Poor 45.1% |
| German Russians | 18.9 /100 | #206 | Poor 45.1% |
| Panamanians | 18.4 /100 | #207 | Poor 45.1% |
| Dutch | 17.6 /100 | #208 | Poor 45.0% |
| Immigrants | Costa Rica | 16.7 /100 | #209 | Poor 45.0% |
| Immigrants | Philippines | 16.7 /100 | #210 | Poor 45.0% |
| Immigrants | Zaire | 16.6 /100 | #211 | Poor 45.0% |
Demographics Similar to Immigrants from Cabo Verde by Associate's Degree
In terms of associate's degree, the demographic groups most similar to Immigrants from Cabo Verde are Arapaho (36.7%, a difference of 0.16%), Menominee (36.7%, a difference of 0.27%), Kiowa (36.5%, a difference of 0.83%), Dutch West Indian (36.5%, a difference of 0.85%), and Alaskan Athabascan (36.5%, a difference of 0.86%).
| Demographics | Rating | Rank | Associate's Degree |
| Crow | 0.0 /100 | #316 | Tragic 37.6% |
| Yaqui | 0.0 /100 | #317 | Tragic 37.6% |
| Alaska Natives | 0.0 /100 | #318 | Tragic 37.5% |
| Fijians | 0.0 /100 | #319 | Tragic 37.4% |
| Cajuns | 0.0 /100 | #320 | Tragic 37.4% |
| Immigrants | Yemen | 0.0 /100 | #321 | Tragic 37.3% |
| Pennsylvania Germans | 0.0 /100 | #322 | Tragic 37.2% |
| Immigrants | Cabo Verde | 0.0 /100 | #323 | Tragic 36.8% |
| Arapaho | 0.0 /100 | #324 | Tragic 36.7% |
| Menominee | 0.0 /100 | #325 | Tragic 36.7% |
| Kiowa | 0.0 /100 | #326 | Tragic 36.5% |
| Dutch West Indians | 0.0 /100 | #327 | Tragic 36.5% |
| Alaskan Athabascans | 0.0 /100 | #328 | Tragic 36.5% |
| Paiute | 0.0 /100 | #329 | Tragic 36.4% |
| Apache | 0.0 /100 | #330 | Tragic 36.2% |