Nigerian vs Immigrants from Zimbabwe Associate's Degree
COMPARE
Nigerian
Immigrants from Zimbabwe
Associate's Degree
Associate's Degree Comparison
Nigerians
Immigrants from Zimbabwe
45.1%
ASSOCIATE'S DEGREE
19.1/ 100
METRIC RATING
204th/ 347
METRIC RANK
50.5%
ASSOCIATE'S DEGREE
99.2/ 100
METRIC RATING
76th/ 347
METRIC RANK
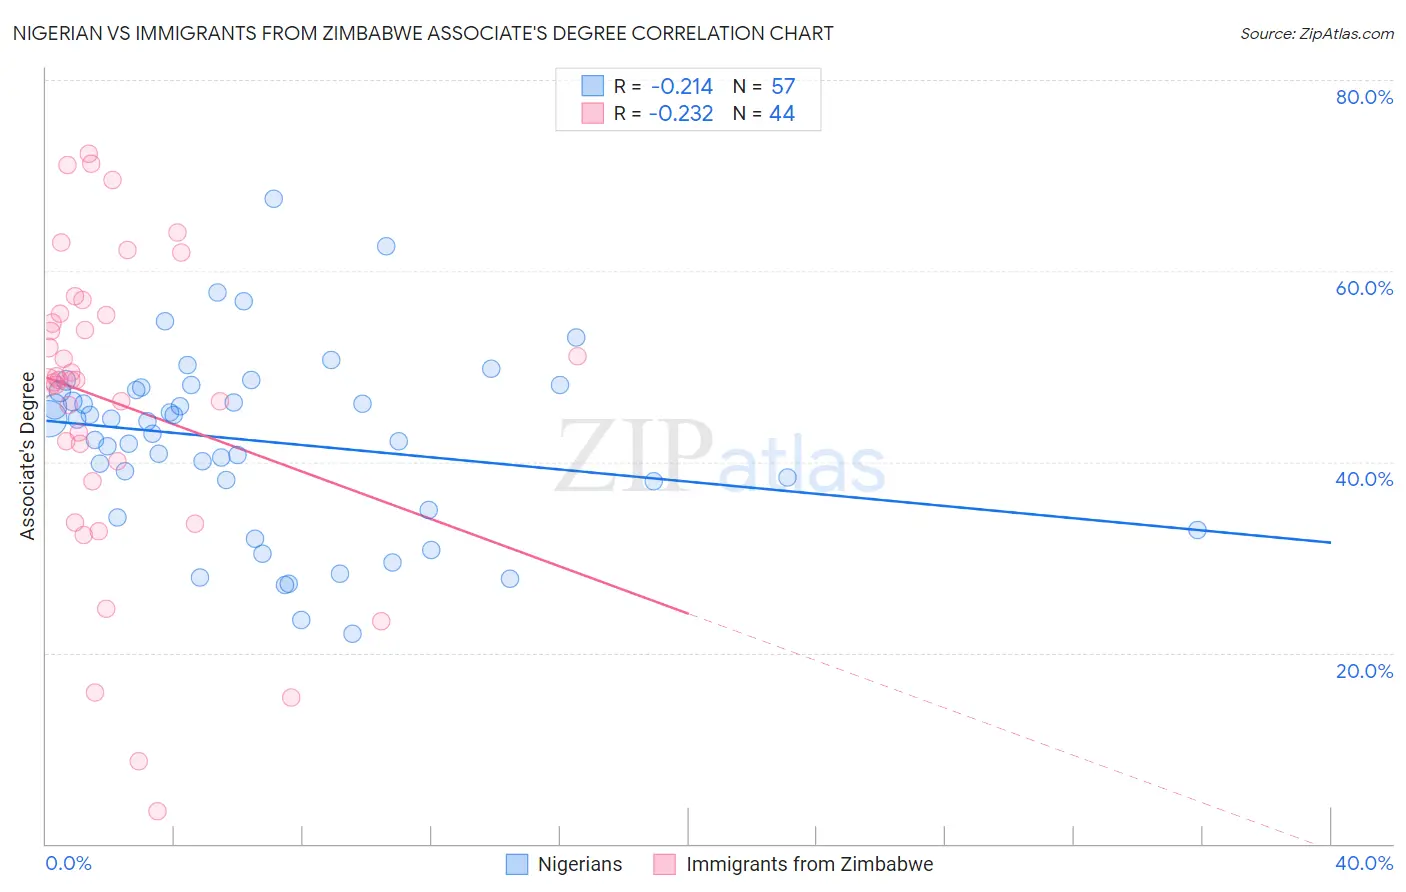
Nigerian vs Immigrants from Zimbabwe Associate's Degree Correlation Chart
The statistical analysis conducted on geographies consisting of 332,751,702 people shows a weak negative correlation between the proportion of Nigerians and percentage of population with at least associate's degree education in the United States with a correlation coefficient (R) of -0.214 and weighted average of 45.1%. Similarly, the statistical analysis conducted on geographies consisting of 117,809,864 people shows a weak negative correlation between the proportion of Immigrants from Zimbabwe and percentage of population with at least associate's degree education in the United States with a correlation coefficient (R) of -0.232 and weighted average of 50.5%, a difference of 11.9%.
Associate's Degree Correlation Summary
| Measurement | Nigerian | Immigrants from Zimbabwe |
| Minimum | 22.0% | 3.5% |
| Maximum | 67.5% | 72.3% |
| Range | 45.6% | 68.9% |
| Mean | 42.1% | 46.2% |
| Median | 44.3% | 48.6% |
| Interquartile 25% (IQ1) | 36.5% | 39.0% |
| Interquartile 75% (IQ3) | 47.7% | 55.5% |
| Interquartile Range (IQR) | 11.2% | 16.4% |
| Standard Deviation (Sample) | 9.4% | 16.2% |
| Standard Deviation (Population) | 9.4% | 16.0% |
Similar Demographics by Associate's Degree
Demographics Similar to Nigerians by Associate's Degree
In terms of associate's degree, the demographic groups most similar to Nigerians are Immigrants from Thailand (45.1%, a difference of 0.020%), German Russian (45.1%, a difference of 0.030%), Panamanian (45.1%, a difference of 0.090%), Immigrants from South Eastern Asia (45.2%, a difference of 0.14%), and Spaniard (45.2%, a difference of 0.16%).
| Demographics | Rating | Rank | Associate's Degree |
| Scotch-Irish | 22.3 /100 | #197 | Fair 45.3% |
| Immigrants | Bangladesh | 21.3 /100 | #198 | Fair 45.2% |
| Immigrants | Senegal | 21.2 /100 | #199 | Fair 45.2% |
| Senegalese | 21.1 /100 | #200 | Fair 45.2% |
| Immigrants | Vietnam | 20.8 /100 | #201 | Fair 45.2% |
| Spaniards | 20.4 /100 | #202 | Fair 45.2% |
| Immigrants | South Eastern Asia | 20.2 /100 | #203 | Fair 45.2% |
| Nigerians | 19.1 /100 | #204 | Poor 45.1% |
| Immigrants | Thailand | 18.9 /100 | #205 | Poor 45.1% |
| German Russians | 18.9 /100 | #206 | Poor 45.1% |
| Panamanians | 18.4 /100 | #207 | Poor 45.1% |
| Dutch | 17.6 /100 | #208 | Poor 45.0% |
| Immigrants | Costa Rica | 16.7 /100 | #209 | Poor 45.0% |
| Immigrants | Philippines | 16.7 /100 | #210 | Poor 45.0% |
| Immigrants | Zaire | 16.6 /100 | #211 | Poor 45.0% |
Demographics Similar to Immigrants from Zimbabwe by Associate's Degree
In terms of associate's degree, the demographic groups most similar to Immigrants from Zimbabwe are Immigrants from Lebanon (50.5%, a difference of 0.030%), Immigrants from Eastern Europe (50.5%, a difference of 0.080%), Ethiopian (50.4%, a difference of 0.090%), Armenian (50.4%, a difference of 0.12%), and Maltese (50.4%, a difference of 0.19%).
| Demographics | Rating | Rank | Associate's Degree |
| Egyptians | 99.5 /100 | #69 | Exceptional 50.9% |
| Immigrants | Argentina | 99.5 /100 | #70 | Exceptional 50.9% |
| Immigrants | Romania | 99.5 /100 | #71 | Exceptional 50.9% |
| Immigrants | Pakistan | 99.5 /100 | #72 | Exceptional 50.9% |
| Carpatho Rusyns | 99.3 /100 | #73 | Exceptional 50.6% |
| Lithuanians | 99.3 /100 | #74 | Exceptional 50.6% |
| Immigrants | Scotland | 99.3 /100 | #75 | Exceptional 50.6% |
| Immigrants | Zimbabwe | 99.2 /100 | #76 | Exceptional 50.5% |
| Immigrants | Lebanon | 99.1 /100 | #77 | Exceptional 50.5% |
| Immigrants | Eastern Europe | 99.1 /100 | #78 | Exceptional 50.5% |
| Ethiopians | 99.1 /100 | #79 | Exceptional 50.4% |
| Armenians | 99.1 /100 | #80 | Exceptional 50.4% |
| Maltese | 99.1 /100 | #81 | Exceptional 50.4% |
| Greeks | 98.9 /100 | #82 | Exceptional 50.3% |
| Immigrants | Uzbekistan | 98.9 /100 | #83 | Exceptional 50.3% |