Swedish vs Immigrants from Cabo Verde Associate's Degree
COMPARE
Swedish
Immigrants from Cabo Verde
Associate's Degree
Associate's Degree Comparison
Swedes
Immigrants from Cabo Verde
48.4%
ASSOCIATE'S DEGREE
91.5/ 100
METRIC RATING
129th/ 347
METRIC RANK
36.8%
ASSOCIATE'S DEGREE
0.0/ 100
METRIC RATING
323rd/ 347
METRIC RANK
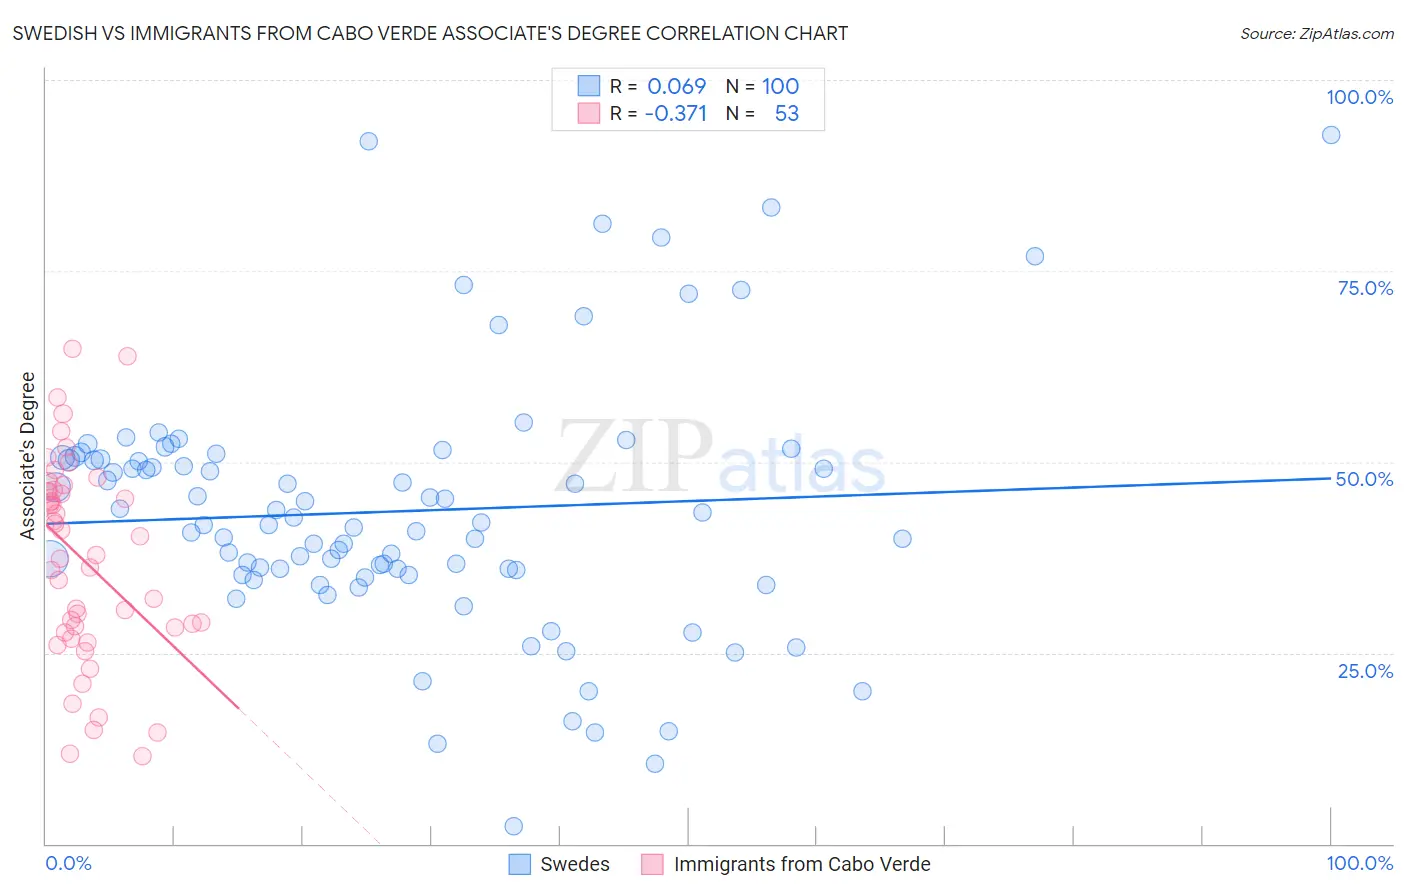
Swedish vs Immigrants from Cabo Verde Associate's Degree Correlation Chart
The statistical analysis conducted on geographies consisting of 539,194,795 people shows a slight positive correlation between the proportion of Swedes and percentage of population with at least associate's degree education in the United States with a correlation coefficient (R) of 0.069 and weighted average of 48.4%. Similarly, the statistical analysis conducted on geographies consisting of 38,158,666 people shows a mild negative correlation between the proportion of Immigrants from Cabo Verde and percentage of population with at least associate's degree education in the United States with a correlation coefficient (R) of -0.371 and weighted average of 36.8%, a difference of 31.6%.
Associate's Degree Correlation Summary
| Measurement | Swedish | Immigrants from Cabo Verde |
| Minimum | 2.3% | 11.5% |
| Maximum | 92.9% | 64.7% |
| Range | 90.6% | 53.3% |
| Mean | 43.5% | 37.2% |
| Median | 41.9% | 37.7% |
| Interquartile 25% (IQ1) | 35.6% | 28.0% |
| Interquartile 75% (IQ3) | 50.4% | 46.2% |
| Interquartile Range (IQR) | 14.9% | 18.3% |
| Standard Deviation (Sample) | 16.5% | 13.1% |
| Standard Deviation (Population) | 16.4% | 13.0% |
Similar Demographics by Associate's Degree
Demographics Similar to Swedes by Associate's Degree
In terms of associate's degree, the demographic groups most similar to Swedes are Immigrants from Eastern Africa (48.4%, a difference of 0.030%), Immigrants from Jordan (48.4%, a difference of 0.060%), Immigrants from Uganda (48.5%, a difference of 0.15%), Immigrants from Syria (48.5%, a difference of 0.16%), and Icelander (48.3%, a difference of 0.16%).
| Demographics | Rating | Rank | Associate's Degree |
| Italians | 93.9 /100 | #122 | Exceptional 48.7% |
| Brazilians | 93.7 /100 | #123 | Exceptional 48.7% |
| Serbians | 92.6 /100 | #124 | Exceptional 48.5% |
| Chinese | 92.5 /100 | #125 | Exceptional 48.5% |
| Immigrants | Syria | 92.2 /100 | #126 | Exceptional 48.5% |
| Immigrants | Uganda | 92.1 /100 | #127 | Exceptional 48.5% |
| Immigrants | Eastern Africa | 91.6 /100 | #128 | Exceptional 48.4% |
| Swedes | 91.5 /100 | #129 | Exceptional 48.4% |
| Immigrants | Jordan | 91.2 /100 | #130 | Exceptional 48.4% |
| Icelanders | 90.8 /100 | #131 | Exceptional 48.3% |
| Immigrants | Albania | 89.9 /100 | #132 | Excellent 48.2% |
| Assyrians/Chaldeans/Syriacs | 89.4 /100 | #133 | Excellent 48.2% |
| Moroccans | 89.3 /100 | #134 | Excellent 48.2% |
| Europeans | 89.0 /100 | #135 | Excellent 48.2% |
| Pakistanis | 88.0 /100 | #136 | Excellent 48.1% |
Demographics Similar to Immigrants from Cabo Verde by Associate's Degree
In terms of associate's degree, the demographic groups most similar to Immigrants from Cabo Verde are Arapaho (36.7%, a difference of 0.16%), Menominee (36.7%, a difference of 0.27%), Kiowa (36.5%, a difference of 0.83%), Dutch West Indian (36.5%, a difference of 0.85%), and Alaskan Athabascan (36.5%, a difference of 0.86%).
| Demographics | Rating | Rank | Associate's Degree |
| Crow | 0.0 /100 | #316 | Tragic 37.6% |
| Yaqui | 0.0 /100 | #317 | Tragic 37.6% |
| Alaska Natives | 0.0 /100 | #318 | Tragic 37.5% |
| Fijians | 0.0 /100 | #319 | Tragic 37.4% |
| Cajuns | 0.0 /100 | #320 | Tragic 37.4% |
| Immigrants | Yemen | 0.0 /100 | #321 | Tragic 37.3% |
| Pennsylvania Germans | 0.0 /100 | #322 | Tragic 37.2% |
| Immigrants | Cabo Verde | 0.0 /100 | #323 | Tragic 36.8% |
| Arapaho | 0.0 /100 | #324 | Tragic 36.7% |
| Menominee | 0.0 /100 | #325 | Tragic 36.7% |
| Kiowa | 0.0 /100 | #326 | Tragic 36.5% |
| Dutch West Indians | 0.0 /100 | #327 | Tragic 36.5% |
| Alaskan Athabascans | 0.0 /100 | #328 | Tragic 36.5% |
| Paiute | 0.0 /100 | #329 | Tragic 36.4% |
| Apache | 0.0 /100 | #330 | Tragic 36.2% |