Nigerian vs Icelander Associate's Degree
COMPARE
Nigerian
Icelander
Associate's Degree
Associate's Degree Comparison
Nigerians
Icelanders
45.1%
ASSOCIATE'S DEGREE
19.1/ 100
METRIC RATING
204th/ 347
METRIC RANK
48.3%
ASSOCIATE'S DEGREE
90.8/ 100
METRIC RATING
131st/ 347
METRIC RANK
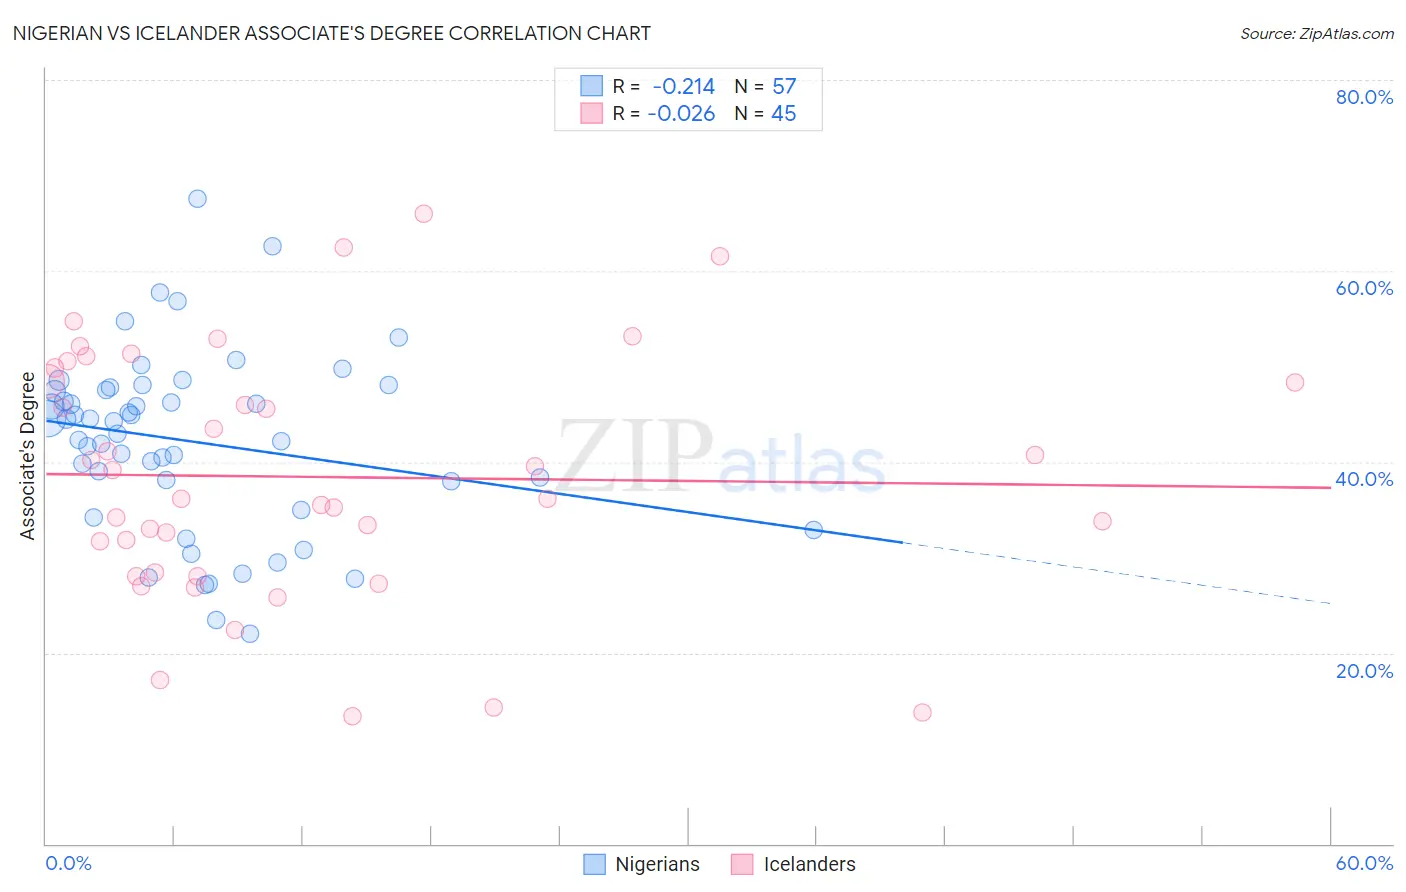
Nigerian vs Icelander Associate's Degree Correlation Chart
The statistical analysis conducted on geographies consisting of 332,751,702 people shows a weak negative correlation between the proportion of Nigerians and percentage of population with at least associate's degree education in the United States with a correlation coefficient (R) of -0.214 and weighted average of 45.1%. Similarly, the statistical analysis conducted on geographies consisting of 159,662,338 people shows no correlation between the proportion of Icelanders and percentage of population with at least associate's degree education in the United States with a correlation coefficient (R) of -0.026 and weighted average of 48.3%, a difference of 7.2%.
Associate's Degree Correlation Summary
| Measurement | Nigerian | Icelander |
| Minimum | 22.0% | 13.3% |
| Maximum | 67.5% | 66.0% |
| Range | 45.6% | 52.6% |
| Mean | 42.1% | 38.4% |
| Median | 44.3% | 36.2% |
| Interquartile 25% (IQ1) | 36.5% | 28.2% |
| Interquartile 75% (IQ3) | 47.7% | 49.1% |
| Interquartile Range (IQR) | 11.2% | 20.9% |
| Standard Deviation (Sample) | 9.4% | 13.0% |
| Standard Deviation (Population) | 9.4% | 12.8% |
Similar Demographics by Associate's Degree
Demographics Similar to Nigerians by Associate's Degree
In terms of associate's degree, the demographic groups most similar to Nigerians are Immigrants from Thailand (45.1%, a difference of 0.020%), German Russian (45.1%, a difference of 0.030%), Panamanian (45.1%, a difference of 0.090%), Immigrants from South Eastern Asia (45.2%, a difference of 0.14%), and Spaniard (45.2%, a difference of 0.16%).
| Demographics | Rating | Rank | Associate's Degree |
| Scotch-Irish | 22.3 /100 | #197 | Fair 45.3% |
| Immigrants | Bangladesh | 21.3 /100 | #198 | Fair 45.2% |
| Immigrants | Senegal | 21.2 /100 | #199 | Fair 45.2% |
| Senegalese | 21.1 /100 | #200 | Fair 45.2% |
| Immigrants | Vietnam | 20.8 /100 | #201 | Fair 45.2% |
| Spaniards | 20.4 /100 | #202 | Fair 45.2% |
| Immigrants | South Eastern Asia | 20.2 /100 | #203 | Fair 45.2% |
| Nigerians | 19.1 /100 | #204 | Poor 45.1% |
| Immigrants | Thailand | 18.9 /100 | #205 | Poor 45.1% |
| German Russians | 18.9 /100 | #206 | Poor 45.1% |
| Panamanians | 18.4 /100 | #207 | Poor 45.1% |
| Dutch | 17.6 /100 | #208 | Poor 45.0% |
| Immigrants | Costa Rica | 16.7 /100 | #209 | Poor 45.0% |
| Immigrants | Philippines | 16.7 /100 | #210 | Poor 45.0% |
| Immigrants | Zaire | 16.6 /100 | #211 | Poor 45.0% |
Demographics Similar to Icelanders by Associate's Degree
In terms of associate's degree, the demographic groups most similar to Icelanders are Immigrants from Jordan (48.4%, a difference of 0.10%), Swedish (48.4%, a difference of 0.16%), Immigrants from Albania (48.2%, a difference of 0.18%), Immigrants from Eastern Africa (48.4%, a difference of 0.19%), and Assyrian/Chaldean/Syriac (48.2%, a difference of 0.27%).
| Demographics | Rating | Rank | Associate's Degree |
| Serbians | 92.6 /100 | #124 | Exceptional 48.5% |
| Chinese | 92.5 /100 | #125 | Exceptional 48.5% |
| Immigrants | Syria | 92.2 /100 | #126 | Exceptional 48.5% |
| Immigrants | Uganda | 92.1 /100 | #127 | Exceptional 48.5% |
| Immigrants | Eastern Africa | 91.6 /100 | #128 | Exceptional 48.4% |
| Swedes | 91.5 /100 | #129 | Exceptional 48.4% |
| Immigrants | Jordan | 91.2 /100 | #130 | Exceptional 48.4% |
| Icelanders | 90.8 /100 | #131 | Exceptional 48.3% |
| Immigrants | Albania | 89.9 /100 | #132 | Excellent 48.2% |
| Assyrians/Chaldeans/Syriacs | 89.4 /100 | #133 | Excellent 48.2% |
| Moroccans | 89.3 /100 | #134 | Excellent 48.2% |
| Europeans | 89.0 /100 | #135 | Excellent 48.2% |
| Pakistanis | 88.0 /100 | #136 | Excellent 48.1% |
| Immigrants | Eritrea | 87.8 /100 | #137 | Excellent 48.1% |
| Poles | 87.3 /100 | #138 | Excellent 48.0% |