Bahamian vs Immigrants from Cabo Verde Associate's Degree
COMPARE
Bahamian
Immigrants from Cabo Verde
Associate's Degree
Associate's Degree Comparison
Bahamians
Immigrants from Cabo Verde
41.5%
ASSOCIATE'S DEGREE
0.4/ 100
METRIC RATING
262nd/ 347
METRIC RANK
36.8%
ASSOCIATE'S DEGREE
0.0/ 100
METRIC RATING
323rd/ 347
METRIC RANK
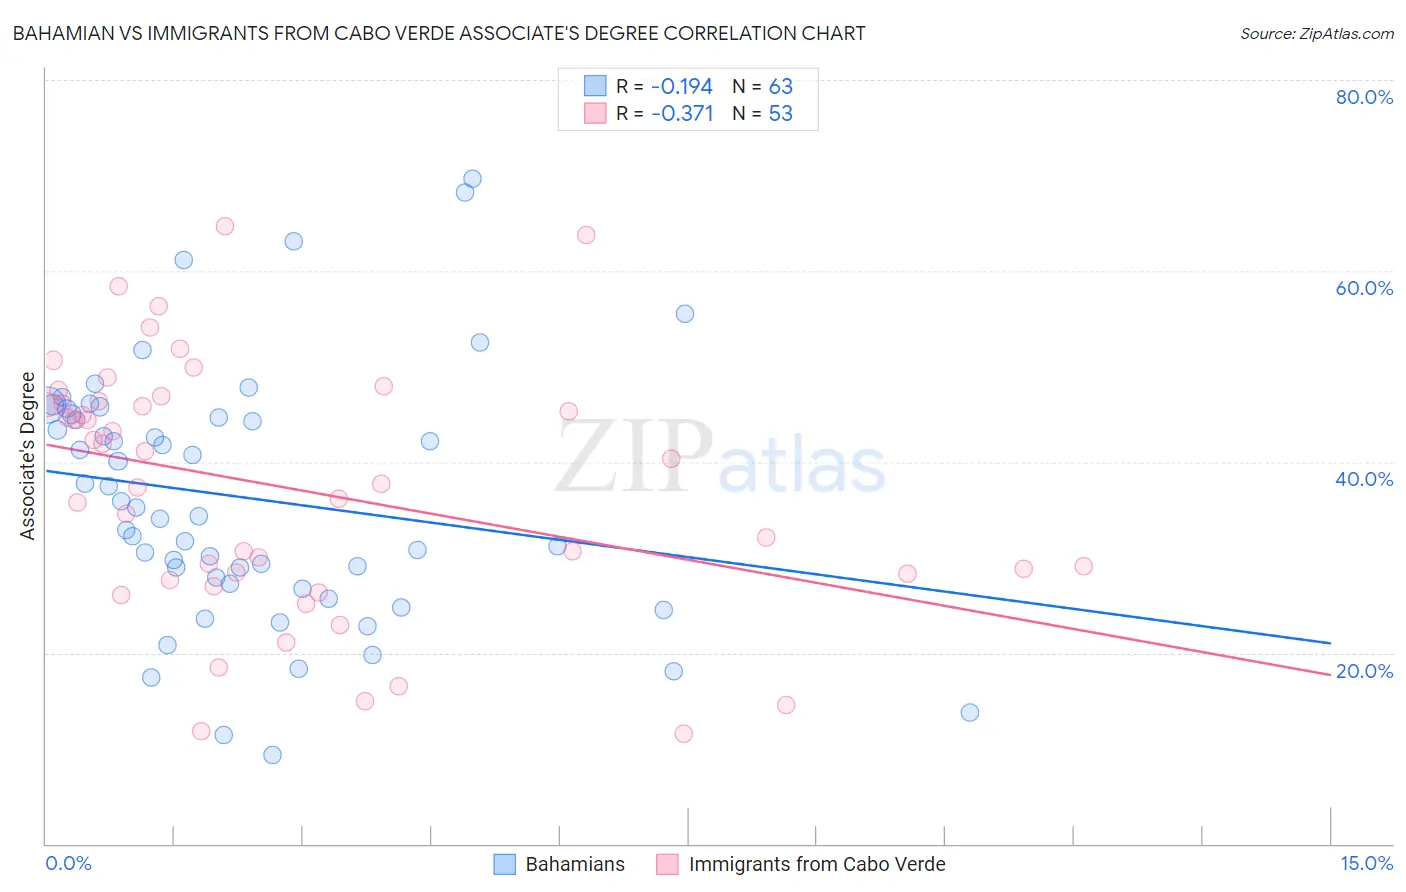
Bahamian vs Immigrants from Cabo Verde Associate's Degree Correlation Chart
The statistical analysis conducted on geographies consisting of 112,704,799 people shows a poor negative correlation between the proportion of Bahamians and percentage of population with at least associate's degree education in the United States with a correlation coefficient (R) of -0.194 and weighted average of 41.5%. Similarly, the statistical analysis conducted on geographies consisting of 38,158,666 people shows a mild negative correlation between the proportion of Immigrants from Cabo Verde and percentage of population with at least associate's degree education in the United States with a correlation coefficient (R) of -0.371 and weighted average of 36.8%, a difference of 12.7%.
Associate's Degree Correlation Summary
| Measurement | Bahamian | Immigrants from Cabo Verde |
| Minimum | 9.3% | 11.5% |
| Maximum | 69.7% | 64.7% |
| Range | 60.4% | 53.3% |
| Mean | 36.3% | 37.2% |
| Median | 35.2% | 37.7% |
| Interquartile 25% (IQ1) | 27.3% | 28.0% |
| Interquartile 75% (IQ3) | 45.0% | 46.2% |
| Interquartile Range (IQR) | 17.7% | 18.3% |
| Standard Deviation (Sample) | 13.1% | 13.1% |
| Standard Deviation (Population) | 13.0% | 13.0% |
Similar Demographics by Associate's Degree
Demographics Similar to Bahamians by Associate's Degree
In terms of associate's degree, the demographic groups most similar to Bahamians are Immigrants from Jamaica (41.5%, a difference of 0.020%), Osage (41.5%, a difference of 0.030%), Nicaraguan (41.5%, a difference of 0.090%), Marshallese (41.6%, a difference of 0.22%), and Malaysian (41.6%, a difference of 0.41%).
| Demographics | Rating | Rank | Associate's Degree |
| Immigrants | Guyana | 0.5 /100 | #255 | Tragic 41.8% |
| Immigrants | Congo | 0.5 /100 | #256 | Tragic 41.8% |
| Spanish Americans | 0.5 /100 | #257 | Tragic 41.8% |
| Japanese | 0.5 /100 | #258 | Tragic 41.7% |
| Malaysians | 0.4 /100 | #259 | Tragic 41.6% |
| Marshallese | 0.4 /100 | #260 | Tragic 41.6% |
| Nicaraguans | 0.4 /100 | #261 | Tragic 41.5% |
| Bahamians | 0.4 /100 | #262 | Tragic 41.5% |
| Immigrants | Jamaica | 0.3 /100 | #263 | Tragic 41.5% |
| Osage | 0.3 /100 | #264 | Tragic 41.5% |
| Africans | 0.2 /100 | #265 | Tragic 41.1% |
| Samoans | 0.2 /100 | #266 | Tragic 41.1% |
| Hawaiians | 0.2 /100 | #267 | Tragic 40.9% |
| Central American Indians | 0.2 /100 | #268 | Tragic 40.8% |
| Americans | 0.2 /100 | #269 | Tragic 40.8% |
Demographics Similar to Immigrants from Cabo Verde by Associate's Degree
In terms of associate's degree, the demographic groups most similar to Immigrants from Cabo Verde are Arapaho (36.7%, a difference of 0.16%), Menominee (36.7%, a difference of 0.27%), Kiowa (36.5%, a difference of 0.83%), Dutch West Indian (36.5%, a difference of 0.85%), and Alaskan Athabascan (36.5%, a difference of 0.86%).
| Demographics | Rating | Rank | Associate's Degree |
| Crow | 0.0 /100 | #316 | Tragic 37.6% |
| Yaqui | 0.0 /100 | #317 | Tragic 37.6% |
| Alaska Natives | 0.0 /100 | #318 | Tragic 37.5% |
| Fijians | 0.0 /100 | #319 | Tragic 37.4% |
| Cajuns | 0.0 /100 | #320 | Tragic 37.4% |
| Immigrants | Yemen | 0.0 /100 | #321 | Tragic 37.3% |
| Pennsylvania Germans | 0.0 /100 | #322 | Tragic 37.2% |
| Immigrants | Cabo Verde | 0.0 /100 | #323 | Tragic 36.8% |
| Arapaho | 0.0 /100 | #324 | Tragic 36.7% |
| Menominee | 0.0 /100 | #325 | Tragic 36.7% |
| Kiowa | 0.0 /100 | #326 | Tragic 36.5% |
| Dutch West Indians | 0.0 /100 | #327 | Tragic 36.5% |
| Alaskan Athabascans | 0.0 /100 | #328 | Tragic 36.5% |
| Paiute | 0.0 /100 | #329 | Tragic 36.4% |
| Apache | 0.0 /100 | #330 | Tragic 36.2% |