Maltese vs Immigrants from Cabo Verde Associate's Degree

COMPARE

Maltese
Race
Ancestry
AfghanAfricanAlaska NativeAlaskan AthabascanAlbanianAleutAlsatianAmericanApacheArabArapahoArgentineanArmenianAssyrian/Chaldean/SyriacAustralianAustrianBahamianBangladeshiBarbadianBasqueBelgianBelizeanBermudanBhutaneseBlackfeetBolivianBrazilianBritishBritish West IndianBulgarianBurmeseCajunCambodianCanadianCape VerdeanCarpatho RusynCelticCentral AmericanCentral American IndianCherokeeCheyenneChickasawChileanChineseChippewaChoctawColombianColvilleComancheCosta RicanCreeCreekCroatianCrowCubanCypriotCzechCzechoslovakianDanishDelawareDominicanDutchDutch West IndianEastern EuropeanEcuadorianEgyptianEnglishEstonianEthiopianEuropeanFijianFilipinoFinnishFrenchFrench American IndianFrench CanadianGermanGerman RussianGhanaianGreekGuamanian/ChamorroGuatemalanGuyaneseHaitianHmongHonduranHopiHoumaHungarianIcelanderIndian (Asian)IndonesianInupiatIranianIraqiIrishIroquoisIsraeliItalianJamaicanJapaneseJordanianKenyanKiowaKoreanLaotianLatvianLebaneseLiberianLithuanianLumbeeLuxembourgerMacedonianMalaysianMalteseMarshalleseMenomineeMexicanMexican American IndianMongolianMoroccanNative HawaiianNavajoNepaleseNew ZealanderNicaraguanNigerianNorthern EuropeanNorwegianOkinawanOsageOttawaPaiutePakistaniPalestinianPanamanianParaguayanPennsylvania GermanPeruvianPimaPolishPortuguesePotawatomiPuebloPuerto RicanPuget Sound SalishRomanianRussianSalvadoranSamoanScandinavianScotch-IrishScottishSeminoleSenegaleseSerbianShoshoneSierra LeoneanSiouxSlavicSlovakSloveneSomaliSouth AfricanSouth AmericanSouth American IndianSoviet UnionSpaniardSpanishSpanish AmericanSpanish American IndianSri LankanSubsaharan AfricanSudaneseSwedishSwissSyrianTaiwaneseThaiTlingit-HaidaTohono O'OdhamTonganTrinidadian and TobagonianTsimshianTurkishU.S. Virgin IslanderUgandanUkrainianUruguayanUteVenezuelanVietnameseWelshWest IndianYakamaYaquiYugoslavianYumanYup'ikZimbabwean
Immigration
NonimmigrantsImmigrantsAfghanistanAfricaAlbaniaArgentinaArmeniaAsiaAustraliaAustriaBahamasBangladeshBarbadosBelarusBelgiumBelizeBoliviaBosnia and HerzegovinaBrazilBulgariaBurma/MyanmarCambodiaCameroonCanadaCaribbeanCentral AmericaChileChinaColombiaCongoCosta RicaCroatiaCubaCzechoslovakiaDenmarkDominicaDominican RepublicEastern AfricaEastern AsiaEastern EuropeEcuadorEgyptEl SalvadorEnglandEritreaEthiopiaEuropeFijiFranceGermanyGhanaGreeceGrenadaGuatemalaGuyanaHaitiHondurasHong KongHungaryIndiaIndonesiaIranIraqIrelandIsraelItalyJamaicaJapanJordanKazakhstanKenyaKoreaKuwaitLaosLatin AmericaLatviaLebanonLiberiaLithuaniaMalaysiaMexicoMicronesiaMiddle AfricaMoldovaMoroccoNepalNetherlandsNicaraguaNigeriaNorth AmericaNorth MacedoniaNorthern AfricaNorthern EuropeNorwayOceaniaPakistanPanamaPeruPhilippinesPolandPortugalRomaniaRussiaSaudi ArabiaScotlandSenegalSerbiaSierra LeoneSingaporeSomaliaSouth AfricaSouth AmericaSouth Central AsiaSouth Eastern AsiaSouthern EuropeSpainSri LankaSt. Vincent and the GrenadinesSudanSwedenSwitzerlandSyriaTaiwanThailandTrinidad and TobagoTurkeyUgandaUkraineUruguayUzbekistanVenezuelaVietnamWest IndiesWestern AfricaWestern AsiaWestern EuropeYemenZaireZimbabweAzores
Immigrants from Cabo Verde
Race
Ancestry
AfghanAfricanAlaska NativeAlaskan AthabascanAlbanianAleutAlsatianAmericanApacheArabArapahoArgentineanArmenianAssyrian/Chaldean/SyriacAustralianAustrianBahamianBangladeshiBarbadianBasqueBelgianBelizeanBermudanBhutaneseBlackfeetBolivianBrazilianBritishBritish West IndianBulgarianBurmeseCajunCambodianCanadianCape VerdeanCarpatho RusynCelticCentral AmericanCentral American IndianCherokeeCheyenneChickasawChileanChineseChippewaChoctawColombianColvilleComancheCosta RicanCreeCreekCroatianCrowCubanCypriotCzechCzechoslovakianDanishDelawareDominicanDutchDutch West IndianEastern EuropeanEcuadorianEgyptianEnglishEstonianEthiopianEuropeanFijianFilipinoFinnishFrenchFrench American IndianFrench CanadianGermanGerman RussianGhanaianGreekGuamanian/ChamorroGuatemalanGuyaneseHaitianHmongHonduranHopiHoumaHungarianIcelanderIndian (Asian)IndonesianInupiatIranianIraqiIrishIroquoisIsraeliItalianJamaicanJapaneseJordanianKenyanKiowaKoreanLaotianLatvianLebaneseLiberianLithuanianLumbeeLuxembourgerMacedonianMalaysianMarshalleseMenomineeMexicanMexican American IndianMongolianMoroccanNative HawaiianNavajoNepaleseNew ZealanderNicaraguanNigerianNorthern EuropeanNorwegianOkinawanOsageOttawaPaiutePakistaniPalestinianPanamanianParaguayanPennsylvania GermanPeruvianPimaPolishPortuguesePotawatomiPuebloPuerto RicanPuget Sound SalishRomanianRussianSalvadoranSamoanScandinavianScotch-IrishScottishSeminoleSenegaleseSerbianShoshoneSierra LeoneanSiouxSlavicSlovakSloveneSomaliSouth AfricanSouth AmericanSouth American IndianSoviet UnionSpaniardSpanishSpanish AmericanSpanish American IndianSri LankanSubsaharan AfricanSudaneseSwedishSwissSyrianTaiwaneseThaiTlingit-HaidaTohono O'OdhamTonganTrinidadian and TobagonianTsimshianTurkishU.S. Virgin IslanderUgandanUkrainianUruguayanUteVenezuelanVietnameseWelshWest IndianYakamaYaquiYugoslavianYumanYup'ikZimbabwean
Immigration
NonimmigrantsImmigrantsAfghanistanAfricaAlbaniaArgentinaArmeniaAsiaAustraliaAustriaBahamasBangladeshBarbadosBelarusBelgiumBelizeBoliviaBosnia and HerzegovinaBrazilBulgariaBurma/MyanmarCabo VerdeCambodiaCameroonCanadaCaribbeanCentral AmericaChileChinaColombiaCongoCosta RicaCroatiaCubaCzechoslovakiaDenmarkDominicaDominican RepublicEastern AfricaEastern AsiaEastern EuropeEcuadorEgyptEl SalvadorEnglandEritreaEthiopiaEuropeFijiFranceGermanyGhanaGreeceGrenadaGuatemalaGuyanaHaitiHondurasHong KongHungaryIndiaIndonesiaIranIraqIrelandIsraelItalyJamaicaJapanJordanKazakhstanKenyaKoreaKuwaitLaosLatin AmericaLatviaLebanonLiberiaLithuaniaMalaysiaMexicoMicronesiaMiddle AfricaMoldovaMoroccoNepalNetherlandsNicaraguaNigeriaNorth AmericaNorth MacedoniaNorthern AfricaNorthern EuropeNorwayOceaniaPakistanPanamaPeruPhilippinesPolandPortugalRomaniaRussiaSaudi ArabiaScotlandSenegalSerbiaSierra LeoneSingaporeSomaliaSouth AfricaSouth AmericaSouth Central AsiaSouth Eastern AsiaSouthern EuropeSpainSri LankaSt. Vincent and the GrenadinesSudanSwedenSwitzerlandSyriaTaiwanThailandTrinidad and TobagoTurkeyUgandaUkraineUruguayUzbekistanVenezuelaVietnamWest IndiesWestern AfricaWestern AsiaWestern EuropeYemenZaireZimbabweAzores
Associate's Degree
Income
Poverty
Unemployment
Labor Participation
Family Structure
Vehicle Availability
Education Level
Disability

Associate's Degree Comparison

Maltese

Immigrants from Cabo Verde

Exceptional
Tragic
50.4%
ASSOCIATE'S DEGREE
99.1/ 100
METRIC RATING
81st/ 347
METRIC RANK
36.8%
ASSOCIATE'S DEGREE
0.0/ 100
METRIC RATING
323rd/ 347
METRIC RANK

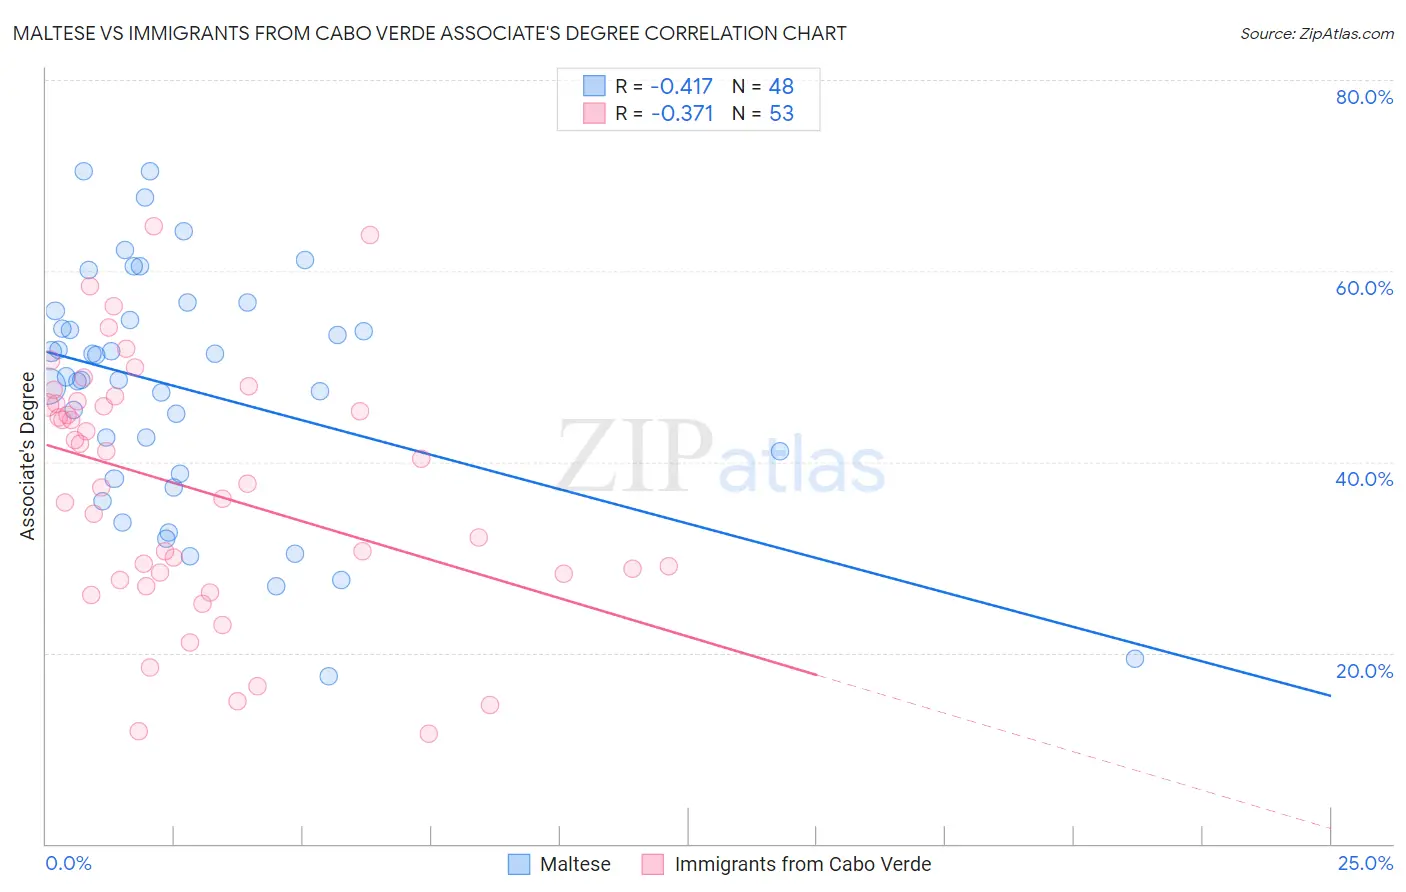
Maltese vs Immigrants from Cabo Verde Associate's Degree Correlation Chart

The statistical analysis conducted on geographies consisting of 126,471,941 people shows a moderate negative correlation between the proportion of Maltese and percentage of population with at least associate's degree education in the United States with a correlation coefficient (R) of -0.417 and weighted average of 50.4%. Similarly, the statistical analysis conducted on geographies consisting of 38,158,666 people shows a mild negative correlation between the proportion of Immigrants from Cabo Verde and percentage of population with at least associate's degree education in the United States with a correlation coefficient (R) of -0.371 and weighted average of 36.8%, a difference of 37.0%.
Maltese vs Immigrants from Cabo Verde Associate's Degree

Associate's Degree Correlation Summary

MeasurementMalteseImmigrants from Cabo Verde
Minimum17.6%11.5%
Maximum70.5%64.7%
Range52.9%53.3%
Mean47.5%37.2%
Median48.7%37.7%
Interquartile 25% (IQ1)38.5%28.0%
Interquartile 75% (IQ3)55.3%46.2%
Interquartile Range (IQR)16.8%18.3%
Standard Deviation (Sample)12.6%13.1%
Standard Deviation (Population)12.5%13.0%

Similar Demographics by Associate's Degree

Demographics Similar to Maltese by Associate's Degree

In terms of associate's degree, the demographic groups most similar to Maltese are Armenian (50.4%, a difference of 0.070%), Ethiopian (50.4%, a difference of 0.10%), Immigrants from Eastern Europe (50.5%, a difference of 0.12%), Immigrants from Lebanon (50.5%, a difference of 0.16%), and Immigrants from Zimbabwe (50.5%, a difference of 0.19%).
DemographicsRating | RankAssociate's Degree
Lithuanians
99.3
/100
|
#74
Exceptional
50.6%
Immigrants | Scotland
99.3
/100
|
#75
Exceptional
50.6%
Immigrants | Zimbabwe
99.2
/100
|
#76
Exceptional
50.5%
Immigrants | Lebanon
99.1
/100
|
#77
Exceptional
50.5%
Immigrants | Eastern Europe
99.1
/100
|
#78
Exceptional
50.5%
Ethiopians
99.1
/100
|
#79
Exceptional
50.4%
Armenians
99.1
/100
|
#80
Exceptional
50.4%
Maltese
99.1
/100
|
#81
Exceptional
50.4%
Greeks
98.9
/100
|
#82
Exceptional
50.3%
Immigrants | Uzbekistan
98.9
/100
|
#83
Exceptional
50.3%
Immigrants | Hungary
98.9
/100
|
#84
Exceptional
50.2%
Immigrants | Egypt
98.9
/100
|
#85
Exceptional
50.2%
Immigrants | Croatia
98.9
/100
|
#86
Exceptional
50.2%
Immigrants | Moldova
98.8
/100
|
#87
Exceptional
50.2%
Immigrants | Canada
98.7
/100
|
#88
Exceptional
50.1%

Demographics Similar to Immigrants from Cabo Verde by Associate's Degree

In terms of associate's degree, the demographic groups most similar to Immigrants from Cabo Verde are Arapaho (36.7%, a difference of 0.16%), Menominee (36.7%, a difference of 0.27%), Kiowa (36.5%, a difference of 0.83%), Dutch West Indian (36.5%, a difference of 0.85%), and Alaskan Athabascan (36.5%, a difference of 0.86%).
DemographicsRating | RankAssociate's Degree
Crow
0.0
/100
|
#316
Tragic
37.6%
Yaqui
0.0
/100
|
#317
Tragic
37.6%
Alaska Natives
0.0
/100
|
#318
Tragic
37.5%
Fijians
0.0
/100
|
#319
Tragic
37.4%
Cajuns
0.0
/100
|
#320
Tragic
37.4%
Immigrants | Yemen
0.0
/100
|
#321
Tragic
37.3%
Pennsylvania Germans
0.0
/100
|
#322
Tragic
37.2%
Immigrants | Cabo Verde
0.0
/100
|
#323
Tragic
36.8%
Arapaho
0.0
/100
|
#324
Tragic
36.7%
Menominee
0.0
/100
|
#325
Tragic
36.7%
Kiowa
0.0
/100
|
#326
Tragic
36.5%
Dutch West Indians
0.0
/100
|
#327
Tragic
36.5%
Alaskan Athabascans
0.0
/100
|
#328
Tragic
36.5%
Paiute
0.0
/100
|
#329
Tragic
36.4%
Apache
0.0
/100
|
#330
Tragic
36.2%